Red Lobster 2013 Annual Report Download - page 32
Download and view the complete annual report
Please find page 32 of the 2013 Red Lobster annual report below. You can navigate through the pages in the report by either clicking on the pages listed below, or by using the keyword search tool below to find specific information within the annual report.-
 1
1 -
2
-
3
-
4
-
5
-
6
-
7
-
8
-
9
-
10
-
11
-
12
-
13
-
14
-
15
-
16
-
17
-
18
-
19
-
20
-
21
-
 22
22 -
 23
23 -
 24
24 -
 25
25 -
 26
26 -
 27
27 -
 28
28 -
 29
29 -
 30
30 -
 31
31 -
 32
32 -
 33
33 -
 34
34 -
 35
35 -
 36
36 -
 37
37 -
 38
38 -
 39
39 -
 40
40 -
 41
41 -
 42
42 -
43
-
44
-
45
-
46
-
47
-
48
-
49
-
50
-
51
-
52
-
53
-
54
-
55
-
56
-
57
-
58
-
59
-
60
-
61
-
62
-
63
-
64
-
65
-
66
-
67
-
68
-
69
-
70
-
71
-
72
-
73
-
74
 |
 |

Management’s Discussion and Analysis
of Financial Condition and Results of Operations
Darden
28 Darden Restaurants, Inc. 2013 Annual Report
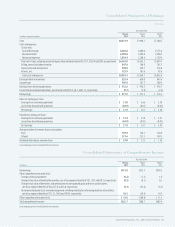
Our fixed-charge coverage ratio, which measures the number of times each
year that we earn enough to cover our fixed charges, amounted to 3.7 times and
5.0 times, on a continuing operations basis, for the fiscal years ended May 26, 2013
and May 27, 2012, respectively. Our adjusted debt to adjusted total capital ratio
(which includes 6.25 times the total annual minimum rent of $164.3 million and
$136.6 million for the fiscal years ended May 26, 2013 and May 27, 2012, respec-
tively, as components of adjusted debt and adjusted total capital) was 65 percent
and 62 percent at May 26, 2013 and May 27, 2012, respectively. We include the
lease-debt equivalent and contractual lease guarantees in our adjusted debt to
adjusted total capital ratio reported to shareholders, as we believe its inclusion
better represents the optimal capital structure that we target from period to
period and because it is consistent with the calculation of the covenant under
our Revolving Credit Agreement.
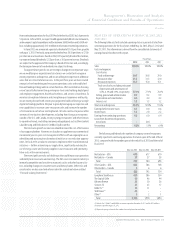
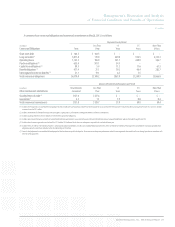
Based on these ratios, we believe our financial condition is strong. The
composition of our capital structure is shown in the following table.
May 26, May 27,
(In millions, except ratios)
2013 2012
CAPITAL STRUCTURE
Short-term debt $ 164.5 $ 262.7
Current portion long-term debt – 350.0
Long-term debt, excluding unamortized discounts 2,501.9 1,459.1
Capital lease obligations 54.4 56.0
Total debt $2,720.8 $2,127.8
Stockholders’ equity 2,059.5 1,842.0
Total capital $4,780.3 $3,969.8
CALCULATION OF ADJUSTED CAPITAL
Total debt $2,720.8 $2,127.8
Lease-debt equivalent 1,026.9 853.8
Guarantees 4.2 5.4
Adjusted debt $3,751.9 $2,987.0
Stockholders’ equity 2,059.5 1,842.0
Adjusted total capital $5,811.4 $4,829.0
CAPITAL STRUCTURE RATIOS
Debt to total capital ratio 57% 54%
Adjusted debt to adjusted total capital ratio 65% 62%
Net cash flows provided by operating activities from continuing operations
were $949.5 million, $762.2 million and $894.7 million in fiscal 2013, 2012
and 2011, respectively. Net cash flows provided by operating activities include
net earnings from continuing operations of $412.6 million, $476.5 million and
$478.7 million in fiscal 2013, 2012 and 2011, respectively. Net cash flows provided
by operating activities from continuing operations increased in fiscal 2013 primarily
due to the timing of inventory purchases as a result of our strategy initiated in
fiscal 2012 to take ownership of our inventory earlier in the supply chain to ensure
a more secure and efficient supply of inventory to our restaurants. Net cash flows
provided by operating activities reflect income tax payments of $98.5 million,
$123.5 million and $126.4 million in fiscal 2013, 2012 and 2011, respectively.
The lower tax payments in fiscal 2013, as compared with tax payments in fiscal
2012 and 2011, primarily relates to the recognition of tax benefits related to the
timing of deductions for fixed-asset related expenditures and the application of
the overpayment of income taxes in prior years to fiscal 2013 tax liabilities.
Net cash flows used in investing activities from continuing operations were
$1,290.4 million, $721.6 million and $552.7 million in fiscal 2013, 2012 and 2011,
respectively. Net cash flows used in investing activities from continuing operations
included capital expenditures incurred principally for building new restaurants,
remodeling existing restaurants, replacing equipment, and technology initia-
tives. Capital expenditures related to continuing operations were $685.6 million
in fiscal 2013, compared to $639.7 million in fiscal 2012 and $547.7 million in
fiscal 2011. The increasing trend of expenditures in fiscal 2013 and 2012 results
primarily from increases in remodel and new restaurant activity over the past
two years. Additionally, net cash used in the acquisitions of Yard House in fiscal
2013 and Eddie V’s in fiscal 2012 was $577.4 million and $58.5 million, respectively.
Net cash flows provided by financing activities from continuing operations
were $355.4 million in fiscal 2013, compared to net cash flows used in financing
activities from continuing operations of $40.4 million and $521.0 million in fiscal
2012 and 2011, respectively. During fiscal 2013, we closed on the issuance of
$300.0 million of senior notes, received funding from a $300.0 million term loan
and completed the offering of $450.0 million of senior notes, resulting in net
proceeds of $445.3 million, which were used to effectively refinance the
$350.0 million of long-term notes that we repaid at maturity during fiscal 2013.
Repayments of long-term debt were $355.9 million, $2.1 million and $226.8 million
in fiscal 2013, 2012 and 2011, respectively. Net repayments of short-term debt
were $98.1 million in fiscal 2013 while net proceeds from the issuance of short-term
debt were $77.2 million and $185.5 million in fiscal 2012 and 2011, respectively.
For fiscal 2013, net cash flows used in financing activities included our repurchase
of 1.0 million shares of our common stock for $52.4 million, compared to 8.2 million
shares of our common stock for $375.1 million in fiscal 2012 and 8.6 million
shares of our common stock for $385.5 million in fiscal 2011. As of May 26, 2013,
our Board of Directors had authorized us to repurchase up to 187.4 million shares
of our common stock and a total of 171.9 million shares had been repurchased
under the authorization. The repurchased common stock reduces stockholders’
equity. As of May 26, 2013, our unused authorization was 15.5 million shares.
We received proceeds primarily from the issuance of common stock upon the
exercise of stock options of $64.4 million, $70.2 million and $63.0 million in fiscal
2013, 2012 and 2011, respectively. Net cash flows used in financing activities also
included dividends paid to stockholders of $258.2 million, $223.9 million and
$175.5 million in fiscal 2013, 2012 and 2011, respectively. The increase in dividend
payments reflects the increase in our annual dividend rate from $1.28 per share
in fiscal 2011, to $1.72 per share in fiscal 2012 and to $2.00 per share in fiscal
2013. In June 2013, our Board of Directors approved an increase in the quarterly
dividend to $0.55 per share, which indicates an annual dividend of $2.20 per
share in fiscal 2014.