Porsche 2007 Annual Report Download - page 183
Download and view the complete annual report
Please find page 183 of the 2007 Porsche annual report below. You can navigate through the pages in the report by either clicking on the pages listed below, or by using the keyword search tool below to find specific information within the annual report.-
 1
1 -
2
-
3
-
4
-
5
-
6
-
7
-
8
-
9
-
10
-
11
-
12
-
13
-
14
-
15
-
16
-
17
-
18
-
19
-
20
-
21
-
22
-
23
-
24
-
25
-
26
-
27
-
28
-
29
-
30
-
31
-
32
-
33
-
34
-
35
-
36
-
37
-
38
-
39
-
40
-
41
-
42
-
43
-
44
-
45
-
46
-
47
-
48
-
49
-
50
-
51
-
52
-
53
-
54
-
55
-
56
-
57
-
58
-
59
-
60
-
61
-
62
-
63
-
64
-
65
-
66
-
67
-
68
-
69
-
70
-
71
-
72
-
73
-
74
-
75
-
76
-
77
-
78
-
79
-
80
-
81
-
82
-
83
-
84
-
85
-
86
-
87
-
88
-
89
-
90
-
91
-
92
-
93
-
94
-
95
-
96
-
97
-
98
-
99
-
100
-
101
-
102
-
103
-
104
-
105
-
106
-
107
-
108
-
109
-
110
-
111
-
112
-
113
-
114
-
115
-
116
-
117
-
118
-
119
-
120
-
121
-
122
-
123
-
124
-
125
-
126
-
127
-
128
-
129
-
130
-
131
-
132
-
133
-
134
-
135
-
136
-
137
-
138
-
139
-
140
-
141
-
142
-
143
-
144
-
145
-
146
-
147
-
148
-
149
-
150
-
151
-
152
-
153
-
154
-
155
-
156
-
157
-
158
-
159
-
160
-
161
-
162
-
163
-
164
-
165
-
166
-
167
-
168
-
169
-
170
-
171
-
172
-
 173
173 -
 174
174 -
 175
175 -
 176
176 -
 177
177 -
 178
178 -
 179
179 -
 180
180 -
 181
181 -
 182
182 -
 183
183 -
 184
184 -
 185
185 -
 186
186 -
 187
187 -
 188
188 -
 189
189 -
 190
190 -
 191
191 -
 192
192 -
 193
193 -
194
-
195
-
196
-
197
-
198
-
199
-
200
-
201
-
202
-
203
-
204
-
205
-
206
-
207
-
208
-
209
-
210
 |
 |
180
To our shareholders
The Company
The new Panamera
Financials
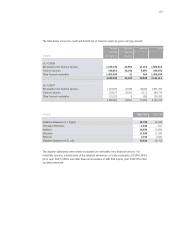
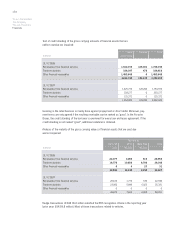
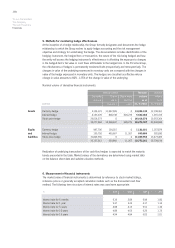
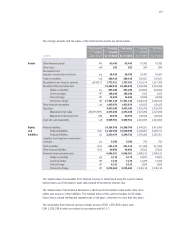
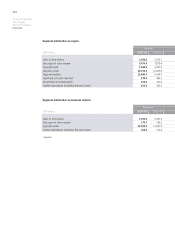
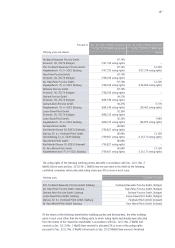
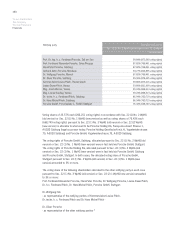
The carrying amounts are allocated to the respective valuation categories as follows:
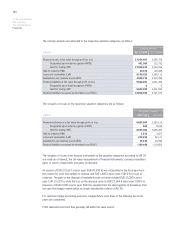
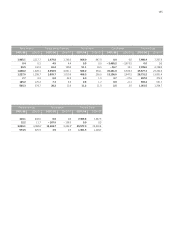
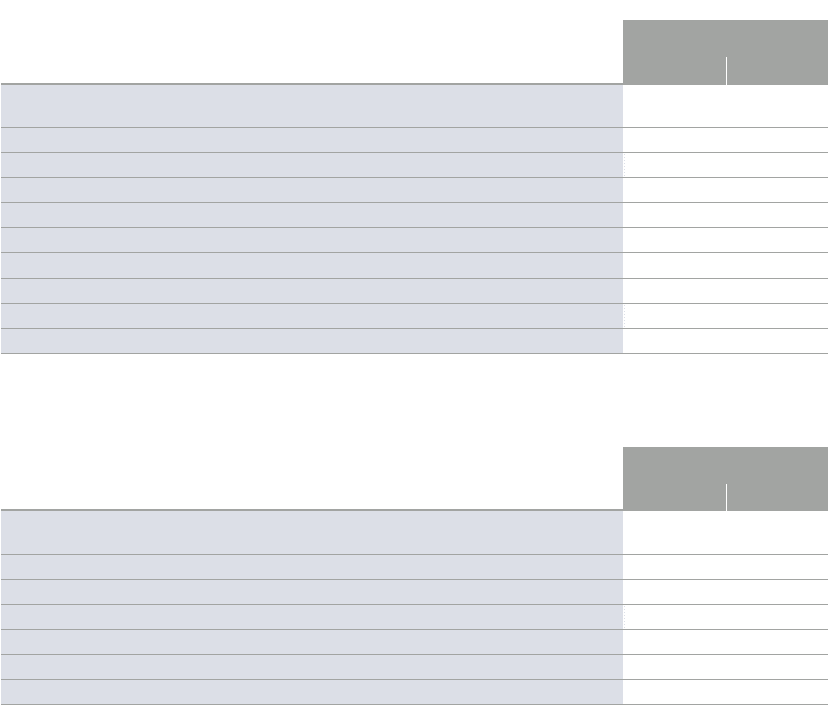
The net gains or losses of the respective valuation categories are as follows:
The net gains or losses from financial instruments in the valuation categories according to IAS 39
are made up of interest, the fair value measurement of financial instruments, currency translation
gains or losses, impairments and gains on disposal.
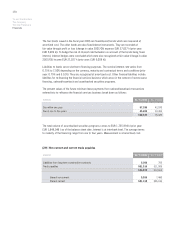
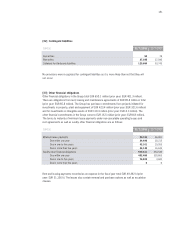
An amount of EUR 272,657 k (prior year: EUR 87,590 k) was reclassified in the fiscal year from
the reserve for cash flow hedges to revenue and EUR 1,845 k (prior year: EUR 0 k) to cost of
materials. The gain on the disposal of available-for-sale securities totaled EUR 15,330 k (prior
year: EUR 15,233 k), while the loss on the disposal came to EUR 27,564 k (prior year: EUR 0 k).
Expenses of EUR 2,500 k (prior year: EUR 0 k) resulted from the derecognition of derivatives from
the cash flow hedge reserve which no longer satisfied the criteria of IAS 39.
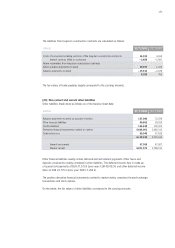
For cash flow hedge accounting purposes, hedged future cash flows of the following five fiscal
years are considered.
Profit realization and cash flow generally fall within the same period.
Carrying amount
EUR000 31/ 7/2008 31/ 7/2007
Financial assets at fair value through profit or loss 17,974,407 5,266,728
Designated upon initial recognition (FVtPL) 431,388 122,732
Held for trading (HfT) 17,543,019 5,143,996
Held to maturity (HtM) 30,576 106,508
Loans and receivables (LaR) 9,132,022 3,266,112
Available-for-sale financial assets (AfS) 3,966,715 2,219,708
Financial liabilities at fair value through profit or loss 5,692,287 2,461,280
Designated upon initial recognition (FVtPL) 00
Held for trading (HfT) 5,692,287 2,461,280
Financial liabilities measured at amortized cost (FLAC) 14,814,940 4,721,915
Net gains or losses
EUR000 2007/08 2006/07
Financial instruments at fair value through profit or loss 6,607,908 3,265,123
Designated upon initial recognition (FVtPL) 523 8,818
Held for trading (HfT) 6,607,385 3,256,305
Held to maturity (HtM) 1,512 3,827
Loans and receivables (LaR) 213,018 46,171
Available-for-sale financial assets (AfS) 79,136 94,940
Financial liabilities measured at amortized cost (FLAC) – 360,442 – 119,656