Porsche 2007 Annual Report Download - page 176
Download and view the complete annual report
Please find page 176 of the 2007 Porsche annual report below. You can navigate through the pages in the report by either clicking on the pages listed below, or by using the keyword search tool below to find specific information within the annual report.-
 1
1 -
2
-
3
-
4
-
5
-
6
-
7
-
8
-
9
-
10
-
11
-
12
-
13
-
14
-
15
-
16
-
17
-
18
-
19
-
20
-
21
-
22
-
23
-
24
-
25
-
26
-
27
-
28
-
29
-
30
-
31
-
32
-
33
-
34
-
35
-
36
-
37
-
38
-
39
-
40
-
41
-
42
-
43
-
44
-
45
-
46
-
47
-
48
-
49
-
50
-
51
-
52
-
53
-
54
-
55
-
56
-
57
-
58
-
59
-
60
-
61
-
62
-
63
-
64
-
65
-
66
-
67
-
68
-
69
-
70
-
71
-
72
-
73
-
74
-
75
-
76
-
77
-
78
-
79
-
80
-
81
-
82
-
83
-
84
-
85
-
86
-
87
-
88
-
89
-
90
-
91
-
92
-
93
-
94
-
95
-
96
-
97
-
98
-
99
-
100
-
101
-
102
-
103
-
104
-
105
-
106
-
107
-
108
-
109
-
110
-
111
-
112
-
113
-
114
-
115
-
116
-
117
-
118
-
119
-
120
-
121
-
122
-
123
-
124
-
125
-
126
-
127
-
128
-
129
-
130
-
131
-
132
-
133
-
134
-
135
-
136
-
137
-
138
-
139
-
140
-
141
-
142
-
143
-
144
-
145
-
146
-
147
-
148
-
149
-
150
-
151
-
152
-
153
-
154
-
155
-
156
-
157
-
158
-
159
-
160
-
161
-
162
-
163
-
164
-
165
-
 166
166 -
 167
167 -
 168
168 -
 169
169 -
 170
170 -
 171
171 -
 172
172 -
 173
173 -
 174
174 -
 175
175 -
 176
176 -
 177
177 -
 178
178 -
 179
179 -
 180
180 -
 181
181 -
 182
182 -
 183
183 -
 184
184 -
 185
185 -
 186
186 -
187
-
188
-
189
-
190
-
191
-
192
-
193
-
194
-
195
-
196
-
197
-
198
-
199
-
200
-
201
-
202
-
203
-
204
-
205
-
206
-
207
-
208
-
209
-
210
 |
 |
173
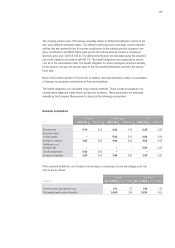
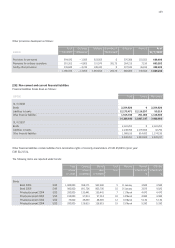
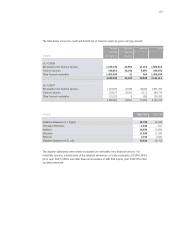
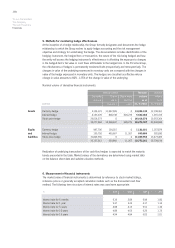
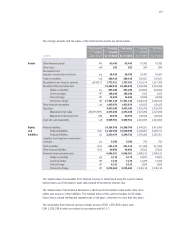
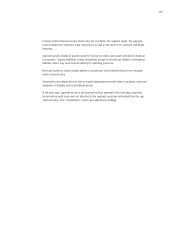
The table below shows the credit and default risk of financial assets by gross carrying amount:
The valuation allowances were mainly recognized on receivables from financial services. For
materiality reasons, a break-down of the valuation allowances on trade receivables of EUR 6,743 k
(prior year: EUR 5,358 k) and other financial receivables of EUR 566 k (prior year: EUR 575 k) has
not been presented.
EUR000
Neither
past due
nor impaired
Past due
and not
impaired
Impaired Total
31/7/2008
Receivables from financial services 1,738,740 28,553 41,319 1,808,612
Trade receivables 198,819 38,343 8,997 246,159
Other financial receivables 1,455,643 31 566 1,456,240
3,393,202 66,927 50,882 3,511,011
31/7/2007
Receivables from financial services 1,753,976 22,930 44,425 1,821,331
Trade receivables 203,277 35,331 6,171 244,779
Other financial receivables 125,372 0 828 126,200
2,082,625 58,261 51,424 2,192,310
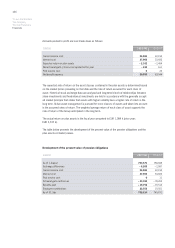
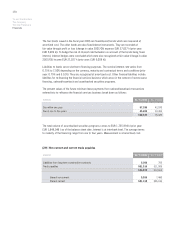
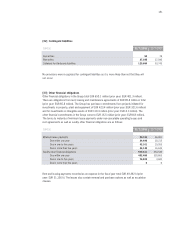
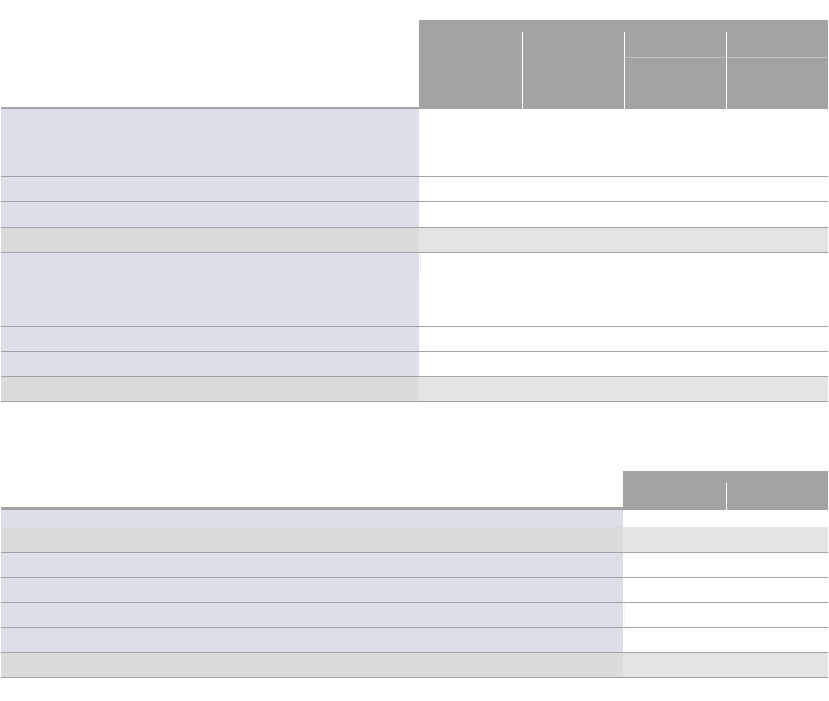
EUR000 2007/08 2006/07
Valuation allowances at 1 August 45,750 45,288
Exchange differences – 2,946 – 937
Additions 14,858 15,083
Utilization 11,683 11,343
Reversal 3,159 2,341
Valuation allowances at 31 July 42,820 45,750