Porsche 2007 Annual Report Download - page 178
Download and view the complete annual report
Please find page 178 of the 2007 Porsche annual report below. You can navigate through the pages in the report by either clicking on the pages listed below, or by using the keyword search tool below to find specific information within the annual report.-
 1
1 -
2
-
3
-
4
-
5
-
6
-
7
-
8
-
9
-
10
-
11
-
12
-
13
-
14
-
15
-
16
-
17
-
18
-
19
-
20
-
21
-
22
-
23
-
24
-
25
-
26
-
27
-
28
-
29
-
30
-
31
-
32
-
33
-
34
-
35
-
36
-
37
-
38
-
39
-
40
-
41
-
42
-
43
-
44
-
45
-
46
-
47
-
48
-
49
-
50
-
51
-
52
-
53
-
54
-
55
-
56
-
57
-
58
-
59
-
60
-
61
-
62
-
63
-
64
-
65
-
66
-
67
-
68
-
69
-
70
-
71
-
72
-
73
-
74
-
75
-
76
-
77
-
78
-
79
-
80
-
81
-
82
-
83
-
84
-
85
-
86
-
87
-
88
-
89
-
90
-
91
-
92
-
93
-
94
-
95
-
96
-
97
-
98
-
99
-
100
-
101
-
102
-
103
-
104
-
105
-
106
-
107
-
108
-
109
-
110
-
111
-
112
-
113
-
114
-
115
-
116
-
117
-
118
-
119
-
120
-
121
-
122
-
123
-
124
-
125
-
126
-
127
-
128
-
129
-
130
-
131
-
132
-
133
-
134
-
135
-
136
-
137
-
138
-
139
-
140
-
141
-
142
-
143
-
144
-
145
-
146
-
147
-
148
-
149
-
150
-
151
-
152
-
153
-
154
-
155
-
156
-
157
-
158
-
159
-
160
-
161
-
162
-
163
-
164
-
165
-
166
-
167
-
 168
168 -
 169
169 -
 170
170 -
 171
171 -
 172
172 -
 173
173 -
 174
174 -
 175
175 -
 176
176 -
 177
177 -
 178
178 -
 179
179 -
 180
180 -
 181
181 -
 182
182 -
 183
183 -
 184
184 -
 185
185 -
 186
186 -
 187
187 -
 188
188 -
189
-
190
-
191
-
192
-
193
-
194
-
195
-
196
-
197
-
198
-
199
-
200
-
201
-
202
-
203
-
204
-
205
-
206
-
207
-
208
-
209
-
210
 |
 |

175
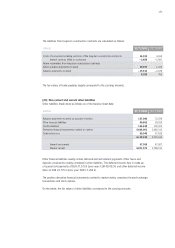
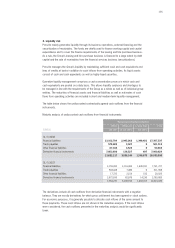
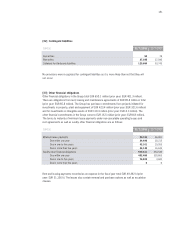
3. Liquidity risk
Porsche mainly generates liquidity through its business operations, external financing and the
securitization of receivables. The funds are chiefly used to finance working capital and capital
expenditures and to cover the finance requirements of the leasing and hire purchase business.
As a rule, the Group’s leasing and hire purchase business is financed to a large extent by debt
capital and the sale of receivables from the financial services business (securitizations).
Porsche manages the Group’s liquidity by maintaining sufficient cash and cash equivalents and
lines of credits at banks in addition to cash inflows from operating activities. Its liquid assets
consist of cash and cash equivalents as well as highly liquid securities.
Operative liquidity management comprises a cash concentration process in which cash and
cash equivalents are pooled on a daily basis. This allows liquidity surpluses and shortages to
be managed in line with the requirements of the Group as a whole as well as of individual group
entities. The maturities of financial assets and financial liabilities as well as estimates of cash
flows from operating activities are included in short and medium-term liquidity management.
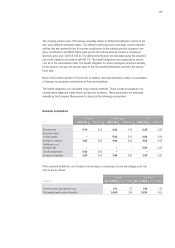
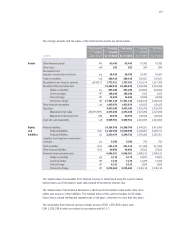
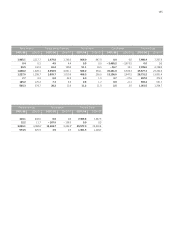
The table below shows the undiscounted contractually agreed cash outflows from the financial
instruments.
Maturity analysis of undiscounted cash outflows from financial instruments:
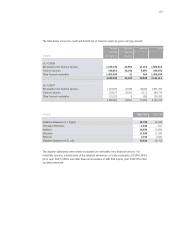
The derivatives include all cash outflows from derivative financial instruments with a negative
balance. They are mostly derivatives for which gross settlement has been agreed or stock options.
For economic purposes, it is generally possible to allocate cash inflows of the same amount to
these payments. These cash inflows are not shown in the maturities analysis. If the cash inflows
were considered, the cash outflows presented in the maturities analysis would be significantly
lower.
Remaining contractual maturities
EUR000
Within
one year
Within one
to five years
In more than
five years
Total
31/7/2008
Financial liabilities 13,102,794 2,945,262 1,349,481 17,397,537
Trade payables 578,489 3,027 0581,516
Other financial liabilities 87,334 3,528 090,862
Derivative financial instruments 7,853,600 136,527 497 7,990,624
21,622,217 3,088,344 1,349,978 26,060,539
31/7/2007
Financial liabilities 3,159,392 3,116,404 1,445,931 7,721,727
Trade payables 504,428 7,480 0511,908
Other financial liabilities 17,722 2,154 150 20,026
Derivative financial instruments 3,672,695 82,878 14,236 3,769,809
7,354,237 3,208,916 1,460,317 12,023,470