NVIDIA 2005 Annual Report Download - page 88
Download and view the complete annual report
Please find page 88 of the 2005 NVIDIA annual report below. You can navigate through the pages in the report by either clicking on the pages listed below, or by using the keyword search tool below to find specific information within the annual report.-
 1
1 -
2
-
3
-
4
-
5
-
6
-
7
-
8
-
9
-
10
-
11
-
12
-
13
-
14
-
15
-
16
-
17
-
18
-
19
-
20
-
21
-
22
-
23
-
24
-
25
-
26
-
27
-
28
-
29
-
30
-
31
-
32
-
33
-
34
-
35
-
36
-
37
-
38
-
39
-
40
-
41
-
42
-
43
-
44
-
45
-
46
-
47
-
48
-
49
-
50
-
51
-
52
-
53
-
54
-
55
-
56
-
57
-
58
-
59
-
60
-
61
-
62
-
63
-
64
-
65
-
66
-
67
-
68
-
69
-
70
-
71
-
72
-
73
-
74
-
75
-
76
-
77
-
 78
78 -
 79
79 -
 80
80 -
 81
81 -
 82
82 -
 83
83 -
 84
84 -
 85
85 -
 86
86 -
 87
87 -
 88
88 -
 89
89 -
 90
90 -
 91
91 -
 92
92 -
 93
93 -
 94
94 -
 95
95 -
 96
96 -
 97
97 -
 98
98 -
99
-
100
-
101
-
102
-
103
-
104
-
105
-
106
-
107
-
108
-
109
-
110
-
111
-
112
-
113
-
114
-
115
-
116
-
117
 |
 |

NVIDIA CORPORATION AND SUBSIDIARIES
NOTES TO CONSOLIDATED FINANCIAL STATEMENTS − (Continued)
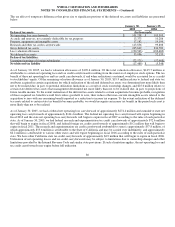
For periods prior to the first quarter of fiscal 2005, product−line operating segment information other than revenue is impracticable to
obtain primarily due to changes in our enterprise resource system structure that we implemented during the first quarter of fiscal 2005.
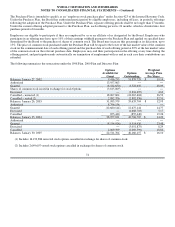
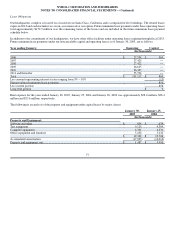
GPU MCP WMP All Other Consolidated
(In thousands)
Twelve Months Ended January 30, 2005:
Revenue $ 1,360,351 $ 424,052 $ 45,921 $ 179,709 $ 2,010,033
Operating income (loss) $ 182,045 $ 66,454 $ (37,532) $ (97,374) $ 113,593
Twelve Months Ended January 25, 2004:
Revenue $ 1,259,803 $ 442,500 $ 9,009 $ 111,633 $ 1,822,945
Twelve Months Ended January 26, 2003:
Revenue $ 1,303,719 $ 498,270 $ −− $ 107,458 $ 1,909,447
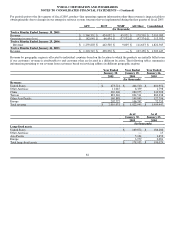
Revenue by geographic region is allocated to individual countries based on the location to which the products are initially billed even
if our customers' revenue is attributable to end customers that are located in a different location. The following tables summarize
information pertaining to our revenue from customers based on invoicing address in different geographic regions:
Year Ended Year Ended Year Ended
January 30, January 25, January 26,
2005 2004 2003
(In thousands)
Revenue:
United States $ 473,721 $ 444,510 $ 601,952
Other Americas 11,045 6,359 1,798
China 269,306 280,975 242,908
Taiwan 883,346 834,511 862,238
Other Asia Pacific 169,888 149,843 127,796
Europe 202,727 106,747 72,755
Total revenue $ 2,010,033 $ 1,822,945 $ 1,909,447
As of As of
January 30, January 25,
2005 2004
(In thousands)
Long−lived assets
United States $ 169,872 $ 186,280
Other Americas −− 15
Asia Pacific 5,104 1,653
Europe 3,979 2,081
Total long−lived assets $ 178,955 $ 190,029
82