NVIDIA 2005 Annual Report Download - page 74
Download and view the complete annual report
Please find page 74 of the 2005 NVIDIA annual report below. You can navigate through the pages in the report by either clicking on the pages listed below, or by using the keyword search tool below to find specific information within the annual report.-
 1
1 -
2
-
3
-
4
-
5
-
6
-
7
-
8
-
9
-
10
-
11
-
12
-
13
-
14
-
15
-
16
-
17
-
18
-
19
-
20
-
21
-
22
-
23
-
24
-
25
-
26
-
27
-
28
-
29
-
30
-
31
-
32
-
33
-
34
-
35
-
36
-
37
-
38
-
39
-
40
-
41
-
42
-
43
-
44
-
45
-
46
-
47
-
48
-
49
-
50
-
51
-
52
-
53
-
54
-
55
-
56
-
57
-
58
-
59
-
60
-
61
-
62
-
63
-
 64
64 -
 65
65 -
 66
66 -
 67
67 -
 68
68 -
 69
69 -
 70
70 -
 71
71 -
 72
72 -
 73
73 -
 74
74 -
 75
75 -
 76
76 -
 77
77 -
 78
78 -
 79
79 -
 80
80 -
 81
81 -
 82
82 -
 83
83 -
 84
84 -
85
-
86
-
87
-
88
-
89
-
90
-
91
-
92
-
93
-
94
-
95
-
96
-
97
-
98
-
99
-
100
-
101
-
102
-
103
-
104
-
105
-
106
-
107
-
108
-
109
-
110
-
111
-
112
-
113
-
114
-
115
-
116
-
117
 |
 |
NVIDIA CORPORATION AND SUBSIDIARIES
NOTES TO CONSOLIDATED FINANCIAL STATEMENTS − (Continued)
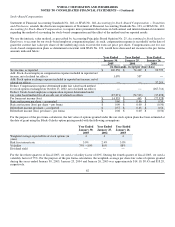
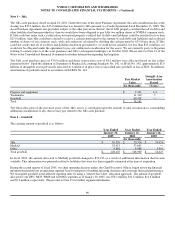
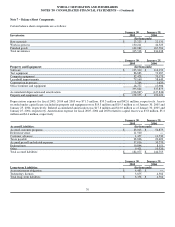
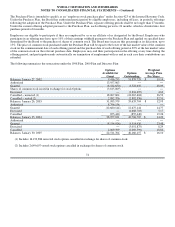
The following is a summary of cash equivalents and marketable securities at January 30, 2005 and January 25, 2004:
January 30, 2005
Amortized
Cost Unrealized
Gain Unrealized
(Loss) Estimated Fair
Value
(In thousands)
Publicly traded equity securities $ 687 $ 220 −− $ 907
Asset−backed securities 177,771 1 (1,786) 175,986
Commercial paper 7,854 −− −− 7,854
Obligations of the United States government & its
agencies 104,768 −− (895) 103,873
United States corporate notes, bonds and obligations 182,688 6 (1,874) 180,820
Money market 164,377 −− −− 164,377
Total $ 638,145 $ 227 $ (4,555) $ 633,817
Classified as:
Cash equivalents $ 172,284
Marketable securities 461,533
Total $ 633,817
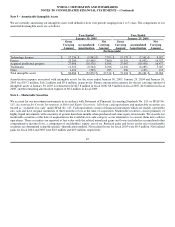
January 25, 2004
Amortized
Cost Unrealized
Gain Unrealized
(Loss) (1) Estimated Fair
Value
(In thousands)
Asset−backed securities $ 65,147 $ 214 $ (127) $ 65,234
Commercial paper 15,592 −− −− 15,592
Obligations of the United States government & its
agencies 198,084 574 (111) 198,547
United States corporate notes, bonds and obligations 175,678 957 (90) 176,545
Money market 143,661 −− −− 143,661
Total $ 598,162 $ 1,745 $ (328) $ 599,579
Classified as:
Cash equivalents $ 209,958
Marketable securities 389,621
Total $ 599,579
(1) The fair value of investments with loss positions is $96.9 million at January 25, 2004. We evaluated the nature of these
investments, which are primarily obligations of the United States government and its agencies and United States corporate notes, the
duration of the impairments, and the amount of the impairments relative to the underlying portfolio and concluded that such amounts
were not “other−than−temporary” as defined by SFAS No. 115, Accounting for Certain Investments in Debt and Equity Securities.
68