NVIDIA 2005 Annual Report Download - page 61
Download and view the complete annual report
Please find page 61 of the 2005 NVIDIA annual report below. You can navigate through the pages in the report by either clicking on the pages listed below, or by using the keyword search tool below to find specific information within the annual report.-
 1
1 -
2
-
3
-
4
-
5
-
6
-
7
-
8
-
9
-
10
-
11
-
12
-
13
-
14
-
15
-
16
-
17
-
18
-
19
-
20
-
21
-
22
-
23
-
24
-
25
-
26
-
27
-
28
-
29
-
30
-
31
-
32
-
33
-
34
-
35
-
36
-
37
-
38
-
39
-
40
-
41
-
42
-
43
-
44
-
45
-
46
-
47
-
48
-
49
-
50
-
 51
51 -
 52
52 -
 53
53 -
 54
54 -
 55
55 -
 56
56 -
 57
57 -
 58
58 -
 59
59 -
 60
60 -
 61
61 -
 62
62 -
 63
63 -
 64
64 -
 65
65 -
 66
66 -
 67
67 -
 68
68 -
 69
69 -
 70
70 -
 71
71 -
72
-
73
-
74
-
75
-
76
-
77
-
78
-
79
-
80
-
81
-
82
-
83
-
84
-
85
-
86
-
87
-
88
-
89
-
90
-
91
-
92
-
93
-
94
-
95
-
96
-
97
-
98
-
99
-
100
-
101
-
102
-
103
-
104
-
105
-
106
-
107
-
108
-
109
-
110
-
111
-
112
-
113
-
114
-
115
-
116
-
117
 |
 |

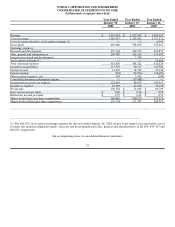
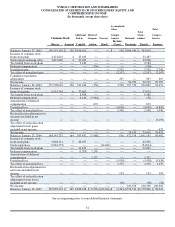
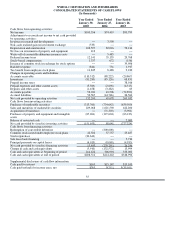
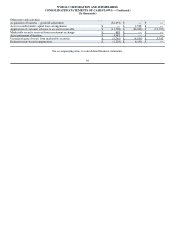
NVIDIA CORPORATION AND SUBSIDIARIES
CONSOLIDATED STATEMENTS OF CASH FLOWS
(In thousands)
Year Ended Year Ended Year Ended
January 30, January 25, January 26,
2005 2004 2003
Cash flows from operating activities:
Net income $100,356 $74,419 $90,799
Adjustments to reconcile net income to net cash provided
by operating activities:
In−process research and development −− 3,500 −−
Non−cash realized gain on investment exchange (533) −− −−
Depreciation and amortization 102,597 82,016 58,216
Net loss on retirements of property and equipment 412 −− −−
Write−off of convertible debenture issuance costs −− 5,485 −−
Deferred income taxes 12,141 55,135 29,768
Stock−based compensation 1,337 672 (156)
Issuance of common stock in exchange for stock options −− −− 39,906
Bad debt expense (844) 731 1,917
Tax benefit from employee stock plans 11,845 8,488 9,180
Changes in operating assets and liabilities:
Accounts receivable (110,312) (88,222) (20,867)
Inventories (81,280) (85,126) 68,831
Prepaid income taxes −− −− 38,016
Prepaid expenses and other current assets (5,569) (2,698) (4,315)
Deposits and other assets (1,458) (3,482) 63
Accounts payable 52,941 43,506 (72,890)
Accrued liabilities 50,567 (44,746) 26,564
Net cash provided by operating activities 132,200 49,678 265,032
Cash flows from investing activities:
Purchases of marketable securities (313,760) (734,642) (639,500)
Sales and maturities of marketable securities 229,068 1,021,590 422,200
Acquisition of businesses −− (71,303) (3,901)
Purchases of property and equipment and intangible
assets (67,261) (127,604) (63,123)
Release of restricted cash −− −− 7,000
Net cash provided by (used in) investing activities (151,953) 88,041 (277,324)
Cash flows from financing activities:
Redemption of convertible debenture −− (300,000) −−
Common stock issued under employee stock plans 42,502 37,757 25,487
Stock repurchase (24,644) −− −−
Sale lease back financing −− −− 5,734
Principal payments on capital leases (4,015) (8,048) (4,935)
Net cash provided by (used in) financing activities 13,843 (270,291) 26,286
Change in cash and cash equivalents (5,910) (132,572) 13,994
Cash and cash equivalents at beginning of period 214,422 346,994 333,000
Cash and cash equivalents at end of period $208,512 $214,422 $346,994
Supplemental disclosures of cash flow information:
Cash paid for interest $163 $15,167 $15,100
Cash paid (refund) for income taxes, net $763 $(211) $(35,101)
55