NVIDIA 2005 Annual Report Download - page 20
Download and view the complete annual report
Please find page 20 of the 2005 NVIDIA annual report below. You can navigate through the pages in the report by either clicking on the pages listed below, or by using the keyword search tool below to find specific information within the annual report.-
 1
1 -
2
-
3
-
4
-
5
-
6
-
7
-
8
-
9
-
 10
10 -
 11
11 -
 12
12 -
 13
13 -
 14
14 -
 15
15 -
 16
16 -
 17
17 -
 18
18 -
 19
19 -
 20
20 -
 21
21 -
 22
22 -
 23
23 -
 24
24 -
 25
25 -
 26
26 -
 27
27 -
 28
28 -
 29
29 -
 30
30 -
31
-
32
-
33
-
34
-
35
-
36
-
37
-
38
-
39
-
40
-
41
-
42
-
43
-
44
-
45
-
46
-
47
-
48
-
49
-
50
-
51
-
52
-
53
-
54
-
55
-
56
-
57
-
58
-
59
-
60
-
61
-
62
-
63
-
64
-
65
-
66
-
67
-
68
-
69
-
70
-
71
-
72
-
73
-
74
-
75
-
76
-
77
-
78
-
79
-
80
-
81
-
82
-
83
-
84
-
85
-
86
-
87
-
88
-
89
-
90
-
91
-
92
-
93
-
94
-
95
-
96
-
97
-
98
-
99
-
100
-
101
-
102
-
103
-
104
-
105
-
106
-
107
-
108
-
109
-
110
-
111
-
112
-
113
-
114
-
115
-
116
-
117
 |
 |

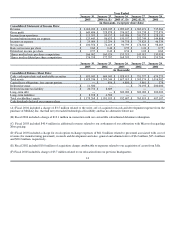
Year Ended
January 30, January 25, January 26, January 27, January 28,
2005 2004 (A, B) 2003 (C, D) 2002 (E, F) 2001
(in thousands, except per share data)
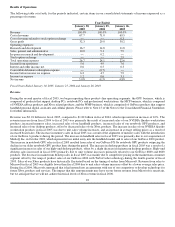
Consolidated Statement of Income Data:
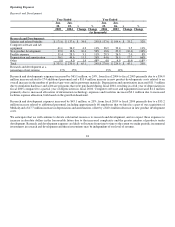
Revenue $ 2,010,033 $ 1,822,945 $ 1,909,447 $ 1,369,471 $ 735,264
Gross profit $ 649,486 $ 528,878 $ 576,012 $ 519,238 $ 272,879
Income from operations $ 113,593 $ 90,157 $ 143,986 $ 241,732 $ 128,135
Income before income tax expense $ 125,445 $ 86,673 $ 150,557 $ 252,749 $ 144,808
Income tax expense $ 25,089 $ 12,254 $ 59,758 $ 75,825 $ 46,339
Net income $ 100,356 $ 74,419 $ 90,799 $ 176,924 $ 98,469
Basic net income per share $ 0.60 $ 0.46 $ 0.59 $ 1.24 $ 0.75
Diluted net income per share $ 0.57 $ 0.43 $ 0.54 $ 1.03 $ 0.62
Shares used in basic per share computation 166,062 160,924 153,513 143,015 130,998
Shares used in diluted per share computation 176,558 172,707 168,393 171,074 159,294
January 30, January 25, January 26, January 27, January 28,
2005 2004 2003 2002 2001
(in thousands)
Consolidated Balance Sheet Data:
Cash, cash equivalents and marketable securities $ 670,045 $ 604,043 $ 1,028,413 $ 791,377 $ 674,275
Total assets $ 1,628,536 $ 1,399,344 $ 1,617,015 $ 1,503,174 $ 1,016,902
Capital lease obligations, less current portion −− $ 856 $ 4,880 $ 5,861 $ 378
Deferred revenue $ 11,500 −− −− $ 70,193 $ 200,000
Deferred income tax liability $ 20,754 $ 8,609 −− −− −−
Long−term debt −− −− $ 300,000 $ 300,000 $ 300,000
Long−term liabilities $ 8,358 $ 4,582 −− −− −−
Total stockholders' equity $ 1,178,268 $ 1,051,185 $ 932,687 $ 763,819 $ 407,107
Cash dividends declared per common share −− −− −− −− −−
___________________________________________________________________________________________
(A) Fiscal 2004 included a charge of $3.5 million related to the write−off of acquired research and development expense from the
purchase of MediaQ, Inc. that had not yet reached technological feasibility and has no alternative future use.
(B) Fiscal 2004 included a charge of $13.1 million in connection with our convertible subordinated debenture redemption.
(C) Fiscal 2003 included $40.4 million in additional revenue related to our settlement of our arbitration with Microsoft regarding
Xbox pricing.
(D) Fiscal 2003 included a charge for stock option exchange expenses of $61.8 million related to personnel associated with cost of
revenue (for manufacturing personnel), research and development and sales, general and administrative of $6.2 million, $35.4 million
and $20.2 million, respectively.
(E) Fiscal 2002 included $10.0 million of acquisition charges attributable to expenses related to our acquisition of assets from 3dfx.
(F) Fiscal 2002 included a charge of $3.7 million related to our relocation from our previous headquarters.
14