NVIDIA 2005 Annual Report Download - page 31
Download and view the complete annual report
Please find page 31 of the 2005 NVIDIA annual report below. You can navigate through the pages in the report by either clicking on the pages listed below, or by using the keyword search tool below to find specific information within the annual report.-
 1
1 -
2
-
3
-
4
-
5
-
6
-
7
-
8
-
9
-
10
-
11
-
12
-
13
-
14
-
15
-
16
-
17
-
18
-
19
-
20
-
 21
21 -
 22
22 -
 23
23 -
 24
24 -
 25
25 -
 26
26 -
 27
27 -
 28
28 -
 29
29 -
 30
30 -
 31
31 -
 32
32 -
 33
33 -
 34
34 -
 35
35 -
 36
36 -
 37
37 -
 38
38 -
 39
39 -
 40
40 -
 41
41 -
42
-
43
-
44
-
45
-
46
-
47
-
48
-
49
-
50
-
51
-
52
-
53
-
54
-
55
-
56
-
57
-
58
-
59
-
60
-
61
-
62
-
63
-
64
-
65
-
66
-
67
-
68
-
69
-
70
-
71
-
72
-
73
-
74
-
75
-
76
-
77
-
78
-
79
-
80
-
81
-
82
-
83
-
84
-
85
-
86
-
87
-
88
-
89
-
90
-
91
-
92
-
93
-
94
-
95
-
96
-
97
-
98
-
99
-
100
-
101
-
102
-
103
-
104
-
105
-
106
-
107
-
108
-
109
-
110
-
111
-
112
-
113
-
114
-
115
-
116
-
117
 |
 |

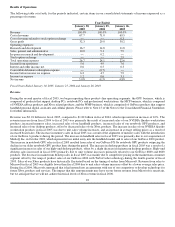
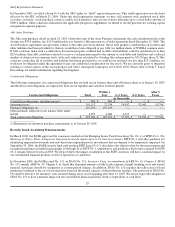
Sales, General and Administrative
Year Ended Year Ended
Jan.
30, Jan.
25, $%Jan.
25, Jan.
26, $%
2005 2004 Change Change 2004 2003 Change Change
(in thousands)
Sales, General and
Administrative:
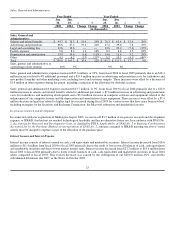
Salaries and related benefits $ 94.7 $ 76.3 $ 18.4 24% $ 76.3 $ 63.4 $ 12.9 20%
Advertising and promotions 66.6 47.2 19.4 41% 47.2 39.6 7.6 19%
Legal and accounting fees 12.6 12.6 −− −− 12.6 20.0 (7.4) (37%)
Facility expense 9.6 8.3 1.3 16% 8.3 6.8 1.5 22%
Depreciation and amortization 13.0 14.6 (1.6) (11%) 14.6 11.4 3.2 28%
Other 4.3 6.2 (1.9) (31%) 6.2 10.3 (4.1) (40%)
Total $ 200.8 $ 165.2 $ 35.6 22% $ 165.2 $ 151.5 $ 13.7 9%
Sales, general and administrative as
a percentage of net revenue 10% 9% 9% 8%
Sales, general and administrative expenses increased $35.6 million, or 22%, from fiscal 2004 to fiscal 2005 primarily due to an $18.4
million increase related to 88 additional personnel and a $19.4 million increase in advertising and promotion costs for tradeshows and
new product launches and other marketing costs, including travel and customer samples. These increases were offset by a decrease of
$1.9 million in other expenses during the period, including a reduction in the allowance for doubtful accounts.
Sales, general and administrative expenses increased $13.7 million, or 9%, from fiscal 2003 to fiscal 2004 primarily due to a $12.9
million increase in salaries and related benefits related to additional personnel, a $7.6 million increase in advertising and promotions
costs for tradeshows and marketing development and a $3.2 million increase in computer software and equipment related to the
enhancement of our computer systems and the depreciation and amortization of new equipment. These increases were offset by a $7.4
million decrease in legal fees related to higher legal fees incurred during fiscal 2003 for various issues that have since been resolved,
including an inquiry by the Securities and Exchange Commission, the Microsoft arbitration and shareholder lawsuits.
In−process research and development
In connection with our acquisition of MediaQ in August 2003, we wrote−off $3.5 million of in−process research and development
expense, or IPR&D, that had not yet reached technological feasibility and has no alternative future use. In accordance with SFAS No.
2, Accounting for Research and Development Costs, as clarified by FIN 4, Applicability of SFAS No. 2 to Business Combinations
Accounted for by the Purchase Method an interpretation of SFAS No. 2, amounts assigned to IPR&D meeting the above−stated
criteria must be charged to expense as part of the allocation of the purchase price.
Interest Income and Interest Expense
Interest income consists of interest earned on cash, cash equivalents and marketable securities. Interest income decreased from $18.6
million to $11.4 million from fiscal 2004 to fiscal 2005 primarily due to the result of lower overall balances of cash, cash equivalents
and marketable securities and due to lower market interest rates. Interest income decreased from $23.2 million to $18.6 million from
fiscal 2003 to fiscal 2004 primarily due to lower overall balances of cash, cash equivalents and marketable securities in fiscal 2004
when compared to fiscal 2003. This overall decrease was caused by the redemption of our $300.0 million 4¾% convertible
subordinated debentures due 2007, or the Notes, in October 2003.
25