NVIDIA 2005 Annual Report Download - page 64
Download and view the complete annual report
Please find page 64 of the 2005 NVIDIA annual report below. You can navigate through the pages in the report by either clicking on the pages listed below, or by using the keyword search tool below to find specific information within the annual report.-
 1
1 -
2
-
3
-
4
-
5
-
6
-
7
-
8
-
9
-
10
-
11
-
12
-
13
-
14
-
15
-
16
-
17
-
18
-
19
-
20
-
21
-
22
-
23
-
24
-
25
-
26
-
27
-
28
-
29
-
30
-
31
-
32
-
33
-
34
-
35
-
36
-
37
-
38
-
39
-
40
-
41
-
42
-
43
-
44
-
45
-
46
-
47
-
48
-
49
-
50
-
51
-
52
-
53
-
 54
54 -
 55
55 -
 56
56 -
 57
57 -
 58
58 -
 59
59 -
 60
60 -
 61
61 -
 62
62 -
 63
63 -
 64
64 -
 65
65 -
 66
66 -
 67
67 -
 68
68 -
 69
69 -
 70
70 -
 71
71 -
 72
72 -
 73
73 -
 74
74 -
75
-
76
-
77
-
78
-
79
-
80
-
81
-
82
-
83
-
84
-
85
-
86
-
87
-
88
-
89
-
90
-
91
-
92
-
93
-
94
-
95
-
96
-
97
-
98
-
99
-
100
-
101
-
102
-
103
-
104
-
105
-
106
-
107
-
108
-
109
-
110
-
111
-
112
-
113
-
114
-
115
-
116
-
117
 |
 |

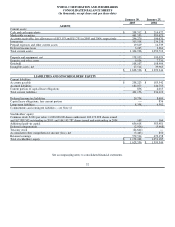
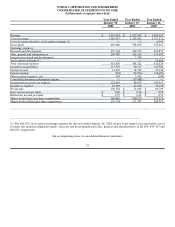
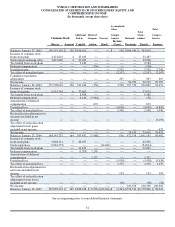
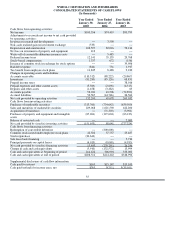
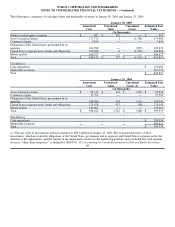
NVIDIA CORPORATION AND SUBSIDIARIES
NOTES TO CONSOLIDATED FINANCIAL STATEMENTS − (Continued)
Marketable Securities
We account for our investment instruments in accordance with Statement of Financial Accounting Standards No. 115, or SFAS No.
115, Accounting for Certain Investments in Debt and Equity Securities. All of our cash equivalents and marketable securities are
treated as “available−for−sale” under SFAS No. 115. Cash equivalents consist of financial instruments which are readily convertible
into cash and have original maturities of three months or less at the time of acquisition. Marketable securities consist primarily of
highly liquid investments with a maturity of greater than three months when purchased. Part of our portfolio includes equity
investments in publicly traded companies. We classify our marketable securities at the date of acquisition in the available−for−sale
category as our intention is to convert them into cash for operations. These securities are reported at fair value with the related
unrealized gains and losses included in accumulated other comprehensive income (loss), a component of stockholders' equity, net of
tax. Realized gains and losses on the sale of marketable securities are determined using the specific−identification method.
Inventories
Inventory cost is computed on an adjusted standard basis (which approximates actual cost on an average or first−in, first−out basis).
We write down our inventory for estimated lower of cost or market, obsolescence or unmarketable inventory equal to the difference
between the cost of inventory and the estimated market value based upon assumptions about future demand, future product purchase
commitments, estimated manufacturing yield levels and market conditions. If actual market conditions are less favorable than those
projected by management, or if our future product purchase commitments to our suppliers exceed our forecasted future demand for
such products, additional future inventory write−downs may be required that could adversely affect our operating results. If actual
market conditions are more favorable, we may have higher gross margins when products are sold. Sales to date of such products have
not had a significant impact on our gross margin. Inventory reserves once established are not reversed until the related inventory has
been sold or scrapped.
Property and Equipment
Property and equipment are stated at cost. Depreciation is computed using the straight−line method based on estimated useful lives,
generally three to five years. Depreciation expense includes the amortization of assets recorded under capital leases. Leasehold
improvements and assets recorded under capital leases are amortized over the shorter of the lease term or the estimated useful life of
the asset.
Debt Financing Costs
In connection with the Notes, see Note 12, we incurred certain direct issuance costs from third parties who performed services that
assisted in the closing of the transaction. These issuance costs were included in our consolidated balance sheet under “deposits and
other assets” and were amortized on a straight line basis over the term of the financing. On October 24, 2003, we fully redeemed the
Notes. In connection with the redemption, we recorded a $13.1 million charge in fiscal 2004, which included the write−off of $5.5
million of unamortized issuance costs.
Advertising Expenses
We expense advertising costs in the period in which they are incurred. Advertising expenses for fiscal 2005, 2004 and 2003 were
approximately $15.2 million, $11.3 million and $6.8 million, respectively.
58