NVIDIA 2005 Annual Report Download - page 59
Download and view the complete annual report
Please find page 59 of the 2005 NVIDIA annual report below. You can navigate through the pages in the report by either clicking on the pages listed below, or by using the keyword search tool below to find specific information within the annual report.-
 1
1 -
2
-
3
-
4
-
5
-
6
-
7
-
8
-
9
-
10
-
11
-
12
-
13
-
14
-
15
-
16
-
17
-
18
-
19
-
20
-
21
-
22
-
23
-
24
-
25
-
26
-
27
-
28
-
29
-
30
-
31
-
32
-
33
-
34
-
35
-
36
-
37
-
38
-
39
-
40
-
41
-
42
-
43
-
44
-
45
-
46
-
47
-
48
-
 49
49 -
 50
50 -
 51
51 -
 52
52 -
 53
53 -
 54
54 -
 55
55 -
 56
56 -
 57
57 -
 58
58 -
 59
59 -
 60
60 -
 61
61 -
 62
62 -
 63
63 -
 64
64 -
 65
65 -
 66
66 -
 67
67 -
 68
68 -
 69
69 -
70
-
71
-
72
-
73
-
74
-
75
-
76
-
77
-
78
-
79
-
80
-
81
-
82
-
83
-
84
-
85
-
86
-
87
-
88
-
89
-
90
-
91
-
92
-
93
-
94
-
95
-
96
-
97
-
98
-
99
-
100
-
101
-
102
-
103
-
104
-
105
-
106
-
107
-
108
-
109
-
110
-
111
-
112
-
113
-
114
-
115
-
116
-
117
 |
 |

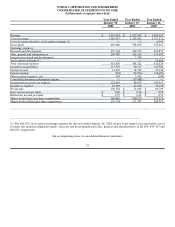
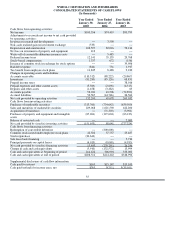
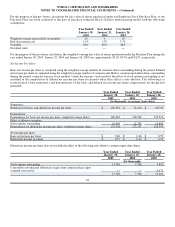
NVIDIA CORPORATION AND SUBSIDIARIES
CONSOLIDATED STATEMENTS OF INCOME
(In thousands, except per share data)
Year Ended Year Ended Year Ended
January 30, January 25, January 26,
2005 2004 2003
Revenue $ 2,010,033 $ 1,822,945 $ 1,909,447
Cost of revenue 1,360,547 1,294,067 1,327,271
Cost of revenue related to stock option exchange (1) −− −− 6,164
Gross profit 649,486 528,878 576,012
Operating expenses:
Research and development 335,104 269,972 224,873
Sales, general and administrative 200,789 165,249 151,485
In−process research and development −− 3,500 −−
Stock option exchange (1) −− −− 55,668
Total operating expenses 535,893 438,721 432,026
Income from operations 113,593 90,157 143,986
Interest income 11,422 18,561 23,246
Interest expense (164) (12,010) (16,467)
Other income (expense), net 594 3,033 (208)
Convertible debenture redemption expense −− (13,068) −−
Income before income tax expense 125,445 86,673 150,557
Income tax expense 25,089 12,254 59,758
Net income 100,356 $ 74,419 $ 90,799
Basic net income per share $ 0.60 $ 0.46 $ 0.59
Diluted net income per share $ 0.57 $ 0.43 $ 0.54
Shares used in basic per share computation 166,062 160,924 153,513
Shares used in diluted per share computation 176,558 172,707 168,393
___________________________________________________________________________________________
(1) The $61,832 stock option exchange expense for the year ended January 26, 2003 relates to personnel associated with cost of
revenue (for manufacturing personnel), research and development and sales, general and administrative of $6,164, $35,417 and
$20,251, respectively.
See accompanying notes to consolidated financial statements.
53