NVIDIA 2004 Annual Report Download - page 47
Download and view the complete annual report
Please find page 47 of the 2004 NVIDIA annual report below. You can navigate through the pages in the report by either clicking on the pages listed below, or by using the keyword search tool below to find specific information within the annual report.-
 1
1 -
2
-
3
-
4
-
5
-
6
-
7
-
8
-
9
-
10
-
11
-
12
-
13
-
14
-
15
-
16
-
17
-
18
-
19
-
20
-
21
-
22
-
23
-
24
-
25
-
26
-
27
-
28
-
29
-
30
-
31
-
32
-
33
-
34
-
35
-
36
-
 37
37 -
 38
38 -
 39
39 -
 40
40 -
 41
41 -
 42
42 -
 43
43 -
 44
44 -
 45
45 -
 46
46 -
 47
47 -
 48
48 -
 49
49 -
 50
50 -
 51
51 -
 52
52 -
 53
53 -
 54
54 -
 55
55 -
 56
56 -
 57
57 -
58
-
59
-
60
-
61
-
62
-
63
-
64
-
65
-
66
-
67
-
68
-
69
 |
 |

Amount Amount
(In thousands)
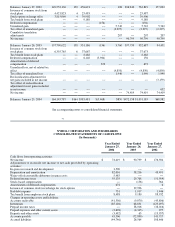
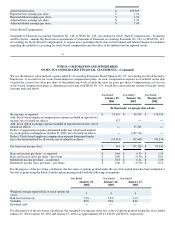
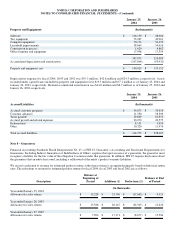
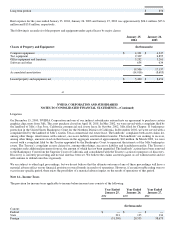
Technology licenses $ 15,178 $ (7,161) $ 8,017 $ 7,028 $ (3,972) $ 3,056
Patents 19,319 (8,992) 10,327 10,319 (4,478) 5,841
Acquired intellectual property 27,067 (10,590) 16,477 11,117 (5,236) 5,881
Trademarks 11,310 (6,283) 5,027 11,310 (4,021) 7,289
Other 250 (135) 115 250 (73) 177
Total intangible assets $ 73,124 $ (33,161) $ 39,963 $ 40,024 $ (17,780) $ 22,244
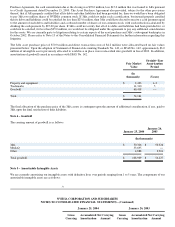
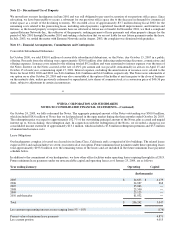
Amortization expense associated with intangible assets for the years ended January 25, 2004 and January 26, 2003 was $16.2 million
and $9.6 million, respectively. Amortization expense for the net carrying amount of intangible assets at January 25, 2004 is estimated
to be $18.4 million in fiscal 2005, $13.4 million in fiscal 2006, $6.5 million in fiscal 2007, $1.5 million in fiscal 2008 and $0.1 million
in fiscal 2009.
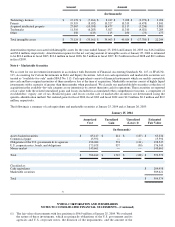
Note 6 – Marketable Securities
We account for our investment instruments in accordance with Statement of Financial Accounting Standards No. 115, or SFAS No.
115, Accounting for Certain Investments in Debt and Equity Securities. All of our cash equivalents and marketable securities are
treated as "available−for−sale" under SFAS No. 115. Cash equivalents consist of financial instruments which are readily convertible
into cash and have original maturities of three months or less at the time of acquisition. Marketable securities consist of highly liquid
investments with a maturity of greater than three months when purchased. We classify our marketable debt securities at the date of
acquisition in the available−for−sale category as our intention is to convert them into cash for operations. These securities are reported
at fair value with the related unrealized gains and losses included in accumulated other comprehensive income, a component of
stockholders’ equity, net of tax. Realized gains and losses on the sale of marketable securities are determined using the
specific−identification method. Net realized gains for fiscal 2004, fiscal 2003 and fiscal 2002 were $2.9 million, $0.3 million and $0.2
million, respectively.
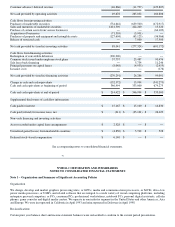
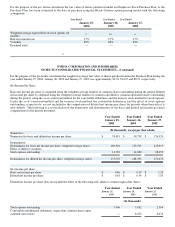
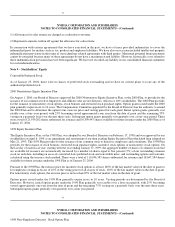
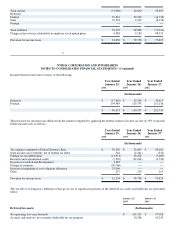
The following is a summary of cash equivalents and marketable securities at January 25, 2004 and at January 26, 2003:
January 25, 2004
Amortized
Cost Unrealized
Gain Unrealized
(Loss) (1) Estimated
Fair Value
(In thousands)
Asset−backed securities $ 65,147 $ 214 $ (127) $ 65,234
Commercial paper 15,592 −− −− 15,592
Obligations of the U.S. government & its agencies 198,084 574 (111) 198,547
U.S. corporate notes, bonds, and obligations 175,678 957 (90) 176,545
Money market 143,661 −− −− 143,661
Total $ 598,162 $ 1,745 $ (328) $ 599,579
Classified as:
Cash equivalents $ 209,958
Marketable securities 389,621
Total $ 599,579
52
NVIDIA CORPORATION AND SUBSIDIARIES
NOTES TO CONSOLIDATED FINANCIAL STATEMENTS – (Continued)
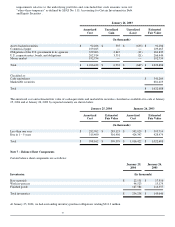
(1) The fair value of investments with loss positions is $96.9 million at January 25, 2004. We evaluated
the nature of these investments, which are primarily obligations of the U.S. government and its
agencies and U.S. corporate notes, the duration of the impairments, and the amount of the