NVIDIA 2004 Annual Report Download - page 42
Download and view the complete annual report
Please find page 42 of the 2004 NVIDIA annual report below. You can navigate through the pages in the report by either clicking on the pages listed below, or by using the keyword search tool below to find specific information within the annual report.-
 1
1 -
2
-
3
-
4
-
5
-
6
-
7
-
8
-
9
-
10
-
11
-
12
-
13
-
14
-
15
-
16
-
17
-
18
-
19
-
20
-
21
-
22
-
23
-
24
-
25
-
26
-
27
-
28
-
29
-
30
-
31
-
 32
32 -
 33
33 -
 34
34 -
 35
35 -
 36
36 -
 37
37 -
 38
38 -
 39
39 -
 40
40 -
 41
41 -
 42
42 -
 43
43 -
 44
44 -
 45
45 -
 46
46 -
 47
47 -
 48
48 -
 49
49 -
 50
50 -
 51
51 -
 52
52 -
53
-
54
-
55
-
56
-
57
-
58
-
59
-
60
-
61
-
62
-
63
-
64
-
65
-
66
-
67
-
68
-
69
 |
 |

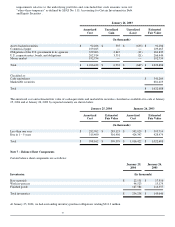
Adjusted net income $ 183,989
Reported basic earnings per share $ 1.24
Reported diluted earnings per share $ 1.03
Adjusted basic earnings per share $ 1.29
Adjusted diluted earnings per share $ 1.08
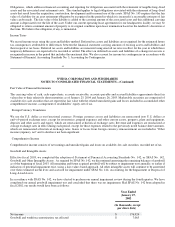
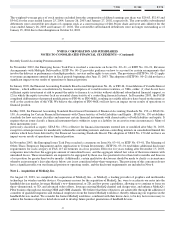
Stock−Based Compensation
Statement of Financial Accounting Standards No. 148, or SFAS No. 148, Accounting for Stock−Based Compensation – Transition
and Disclosure , amends the disclosure requirements of Statement of Financial Accounting Standards No. 123, or SFAS No. 123,
Accounting for Stock−Based Compensation, to require more prominent disclosures in both annual and interim financial statements
regarding the method of accounting for stock−based compensation and the effect of the method used on reported results.
46
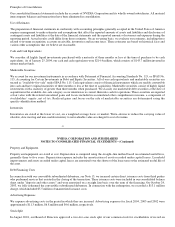
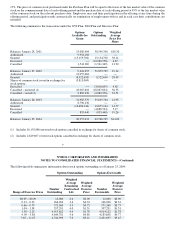
NVIDIA CORPORATION AND SUBSIDIARIES
NOTES TO CONSOLIDATED FINANCIAL STATEMENTS – (Continued)
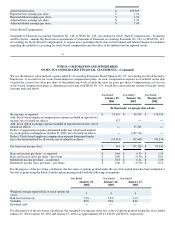
We use the intrinsic value method, as prescribed by Accounting Principles Board Opinion No. 25, Accounting for Stock Issued to
Employees, to account for our stock−based employee compensation plans. As such, compensation expense is recorded if on the date
of grant the current fair value per share of the underlying stock exceeds the exercise price per share. Compensation cost for our
stock−based compensation plans as determined consistent with SFAS No. 123, would have decreased net income to the pro forma
amounts indicated below:
Year Ended Year Ended Year Ended
January 25, January 26, January 27,
2004 2003 2002
(In thousands, except per share data)
Net income, as reported $ 74,419 $ 90,799 $ 176,924
Add: Stock−based employee compensation expense included in reported net
income, net of related tax effects 537 −− −−
Add: Stock option exchange expense included in reported net income, net of
related tax effects −− 37,285 −−
Deduct: Compensation expense determined under fair value based method
for stock options exchanged on October 25, 2002, net of related tax effects −− (167,714) −−
Deduct: Stock−based employee compensation expense determined under
fair value based method for all awards, net of related tax effects (74,513) (37,698) (89,274)
Pro forma net income (loss) $ 443 $ (77,328) $ 87,650
Basic net income per share – as reported $ 0.46 $ 0.59 $ 1.24
Basic net income (loss) per share – pro forma $ 0.00 $ (0.50) $ 0.61
Diluted net income per share – as reported $ 0.43 $ 0.54 $ 1.03
Diluted net income (loss) per share – pro forma $ 0.00 $ (0.50) $ 0.51
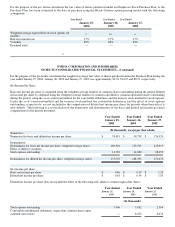
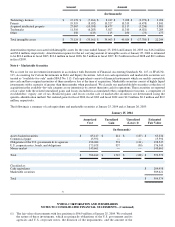
For the purpose of the pro forma calculation, the fair value of options granted under the our stock option plans has been estimated at
the date of grant using the Black−Scholes option pricing model with the following assumptions:
Year Ended Year Ended Year Ended
January 25, January 26, January 27,
2004 2003 2002
Weighted average expected life of stock options (in
years) 444
Risk free interest rate 2.4% 3.8% 4.3%
Volatility 80% 88% 83%
Dividend yield −− −− −−
For the purpose of the pro forma calculation, the weighted−average per share fair value of options granted during the years ended
January 25, 2004, January 26, 2003 and January 25, 2002 was approximately $9.43, $18.29 and $23.94, respectively.