NVIDIA 2004 Annual Report Download - page 20
Download and view the complete annual report
Please find page 20 of the 2004 NVIDIA annual report below. You can navigate through the pages in the report by either clicking on the pages listed below, or by using the keyword search tool below to find specific information within the annual report.-
 1
1 -
2
-
3
-
4
-
5
-
6
-
7
-
8
-
9
-
 10
10 -
 11
11 -
 12
12 -
 13
13 -
 14
14 -
 15
15 -
 16
16 -
 17
17 -
 18
18 -
 19
19 -
 20
20 -
 21
21 -
 22
22 -
 23
23 -
 24
24 -
 25
25 -
 26
26 -
 27
27 -
 28
28 -
 29
29 -
 30
30 -
31
-
32
-
33
-
34
-
35
-
36
-
37
-
38
-
39
-
40
-
41
-
42
-
43
-
44
-
45
-
46
-
47
-
48
-
49
-
50
-
51
-
52
-
53
-
54
-
55
-
56
-
57
-
58
-
59
-
60
-
61
-
62
-
63
-
64
-
65
-
66
-
67
-
68
-
69
 |
 |

due to the decrease in demand for commercial rental space in Silicon Valley. The write−offs consist of all remaining costs related to
the preexisting lease, including rental payments, capitalized leasehold improvements, and furniture and fixtures. In December 2001,
we filed a complaint against Extreme Networks Inc., the sublessor of the property, seeking payment of lease payments and other
property charges for the period of July 2001 through December 2001 and seeking a declaration that we are not liable for any future
payments under the lease. In July, 2003, we settled the matter with Extreme Networks and in August, 2003, the complaint was
dismissed with prejudice.
Interest Income and Interest Expense
Interest income consists of interest earned on cash, cash equivalents and marketable securities. Interest income decreased from $23.2
million to $18.6 million from fiscal 2003 to fiscal 2004 primarily due to lower average balances of cash, cash equivalents and
marketable securities in fiscal 2004 when compared to fiscal 2003. This was caused by the redemption of our $300.0 million
convertible subordinated debentures in October 2003. Interest income decreased from $27.7 million to $23.2 million from fiscal 2002
to fiscal 2003 primarily due to the decline in market interest rates.
Interest expense primarily consists of interest incurred as a result of capital lease obligations and, prior to the redemption in October
2003, interest on our convertible subordinated debentures. Interest expense decreased from $16.5 million to $12.0 million from fiscal
2003 to fiscal 2004 primarily due to the redemption of our convertible subordinated debentures.
Other Income (Expense), net
Other income and expense primarily consists of realized gains and losses on the sale of marketable securities and any gains or losses
related to the disposal of fixed assets. Other income increased by $3.2 million from fiscal 2003 to fiscal 2004 primarily due to $2.5
million of realized gains on the sale of marketable securities during the third quarter of fiscal 2004 as a result of our liquidation of a
significant portion of our marketable securities portfolio in order to obtain the cash required to redeem our convertible subordinated
debentures in October 2003.
Convertible Debenture Redemption Expense
On October 24, 2003, we fully redeemed our $300.0 million of 4¾% convertible subordinated debentures due 2007, or the Notes. The
aggregate principal amount of the Notes outstanding was $300.0 million, which included $18.6 million of Notes that we had
purchased in the open market during the three months ended October 26, 2003. The redemption price was equal to approximately
102.7% of the outstanding principal amount of the Notes, plus accrued and unpaid interest up to, but excluding, the redemption date.
In connection with the redemption of the Notes, we recorded a one−time charge of approximately $13.1 million, which included a
$7.6 million redemption premium and $5.5 million of unamortized issuance costs.
19
Income Taxes
We recognized income tax expense of $12.3 million, $59.8 million and $75.8 million in fiscal 2004, 2003 and 2002 respectively.
Income tax expense as a percentage of income before taxes, or our annual effective tax rate, was 14.1% in fiscal 2004, 39.7% in fiscal
2003 and 30.0% in fiscal 2002.
Significant items impacting our annual effective tax rate in fiscal 2004 included the $3.5 million MediaQ IPR&D write−off for which
no tax benefit was recognized, the $75.0 million income tax benefit of certain tax contingencies as a result of settlement of our IRS
exam, the $38.2 million income tax expense for the accrual of U.S. deferred income taxes on previous permanently reinvested foreign
earnings and the $33.6 million income tax expense for the establishment of a valuation allowance on certain previously recognized
state deferred tax assets determined not more likely than not to be realized due, in part, to projections of future sources of taxable
income.
Please refer to Note 14 of the Notes to the Consolidated Financial Statements for further information regarding the components of
income tax expense.
The increase in our annual effective tax rate from fiscal 2002 to fiscal 2003 was primarily due to our not recording any income tax
expense or benefit for the third quarter of fiscal 2003 as our loss before income tax expense for that quarter was primarily attributable
to a stock compensation charge for which no tax benefit may be available.
We expect our annual effective income tax rate to be 20% for fiscal 2005. Please refer to Part II, Item 7 "Critical Accounting Policies
− Income Taxes" for items that may affect this estimate.
Liquidity and Capital Resources
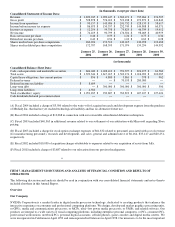
As of January 25, 2004, we had $604.0 million in cash, cash equivalents and marketable securities, a decrease of $424.4 million from
the end of fiscal 2003. The decrease was primarily due to the $300.0 million redemption of the Notes in October 2003 and the $71.3