NVIDIA 2004 Annual Report Download - page 18
Download and view the complete annual report
Please find page 18 of the 2004 NVIDIA annual report below. You can navigate through the pages in the report by either clicking on the pages listed below, or by using the keyword search tool below to find specific information within the annual report.-
 1
1 -
2
-
3
-
4
-
5
-
6
-
7
-
 8
8 -
 9
9 -
 10
10 -
 11
11 -
 12
12 -
 13
13 -
 14
14 -
 15
15 -
 16
16 -
 17
17 -
 18
18 -
 19
19 -
 20
20 -
 21
21 -
 22
22 -
 23
23 -
 24
24 -
 25
25 -
 26
26 -
 27
27 -
 28
28 -
29
-
30
-
31
-
32
-
33
-
34
-
35
-
36
-
37
-
38
-
39
-
40
-
41
-
42
-
43
-
44
-
45
-
46
-
47
-
48
-
49
-
50
-
51
-
52
-
53
-
54
-
55
-
56
-
57
-
58
-
59
-
60
-
61
-
62
-
63
-
64
-
65
-
66
-
67
-
68
-
69
 |
 |

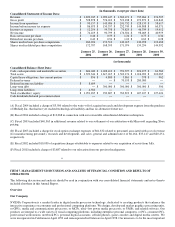
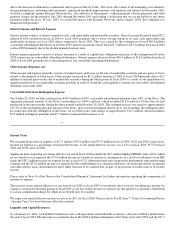
Fiscal Years Ended January 25, 2004, January 26, 2003, and January 27, 2002
Revenue
Revenue was $1.82 billion in fiscal 2004, $1.91 billion in fiscal 2003, and $1.37 billion in fiscal 2002, which represented a decrease of
5% from fiscal 2003 to 2004 and an increase of 39% from fiscal 2002 to 2003. The revenue decrease from fiscal 2003 to fiscal 2004
was primarily the result of a significant decrease in sales of Xbox processors to Microsoft, offset by growth in our GPU, MCP and
UMP products. The revenue growth from fiscal 2002 to fiscal 2003 was primarily the result of significant sales of Xbox processors in
addition to the strong overall demand for our GPU and MCP products.
Revenue from sales to customers outside of the United States and other Americas accounted for 75%, 68% and 82% of total revenue
for fiscal 2004, 2003 and 2002, respectively. Revenue by geographic region is allocated to individual countries based on the location
to which the products are initially billed even if the foreign CEMs’ and add−in board and motherboard manufacturers’ revenue is
attributable to end customers in a different location. The increase in the percentage of revenue from sales to customers outside of the
United States and other Americas for fiscal 2004 as compared to fiscal 2003 is primarily due to decreased sales of XGPUs and MCPs
used in the Microsoft Xbox product, which are billed to Microsoft in the United States. The decrease in the percentage of revenue
from sales to customers outside of the United States for fiscal 2003 as compared to fiscal 2002 is primarily due to increased sales of
XGPUs and MCPs used in the Microsoft Xbox product.
Sales to Microsoft accounted for approximately 15% of revenues for fiscal 2004. Our other three largest customers accounted for
approximately 45% of revenues for fiscal 2004. In fiscal 2003, sales to Microsoft accounted for approximately 23% of revenues. Our
other three largest customers accounted for approximately 41% of revenues for fiscal 2003. In fiscal 2002, sales to Microsoft
accounted for approximately 9% of revenues. Our other three largest customers accounted for approximately 44% of revenues for
fiscal 2002.
In future periods, our revenue may be affected by demand for and market acceptance of our products and/or our customers’ products,
our ability to successfully develop and produce our products in volume production, competitive pressures resulting in lower than
expected average selling prices, and new product announcements or product introductions by our competitors.
Gross Profit
Gross profit consists of total revenue, net of allowances, less cost of revenue. Cost of revenue consists primarily of the cost of
semiconductors purchased from subcontractors (including wafer fabrication, assembly, testing and packaging), manufacturing support
costs (including labor and overhead associated with such purchases), final test yield fallout, inventory provisions and shipping costs.
Gross margin is the ratio of gross profit to revenue. Our gross margin can vary in any period depending on the mix of types of
products sold.
Our gross margin was 29%, 30% and 38% in fiscal 2004, 2003 and 2002, respectively. Gross margin for fiscal 2004 as compared to
fiscal 2003 decreased primarily due to a shift in the mix of product sales to our new generation of GeForce FX products. Our GeForce
FX products generally have experienced lower gross margins than previous GeForce products. This decrease was offset by an increase
in gross margins on sales of Xbox processors in fiscal 2004 when compared to fiscal 2003, which resulted from the pricing settlement
with Microsoft that we announced on February 6, 2003. Gross margin for fiscal 2003 as compared to fiscal 2002 decreased primarily
due to a shift in mix of product sales that included more sales of Xbox processors which, at that time, generally had lower margins
than our other products. In addition, the decrease was due to an inventory write−down of approximately $21.0 million related to
certain Xbox processors and nForce platform processors during the second quarter of fiscal 2003, and the stock option exchange
expense of $6.2 million that was charged to cost of revenue related to manufacturing personnel during the third quarter of fiscal 2003.
In the future, we could be subject to excess or obsolete inventories and be required to take additional write−downs if growth slows or
if we incorrectly forecast product demand. A reduction in demand and market acceptance of our products and/or our customers’
products could also negatively impact our gross margins. We do not expect past results to be indicative of future periods. We remain
intensely focused on driving down cost and improving gross margins. We expect improvement in our gross margins and believe our
gross margins can be 30% or more.
Operating Expenses
Research and Development. Research and development expenses consist of salaries and benefits, cost of development tools and
software, cost of new product prototypes and consultant costs. Research and development expenses increased by $45.1 million, or
20%, from fiscal 2003 to fiscal 2004 primarily due to a $33.2 million increase related to additional personnel, including approximately
60 employees that we obtained as a result of our acquisition of MediaQ, a $21.2 million increase associated with lab equipment,
software licenses, maintenance fees and increased depreciation and amortization charges, and a $2.0 million increase in facility
expenses, offset by a $11.3 million decrease in new product development costs and other expenses during the period. Research and
development expenses increased by $70.1 million, or 45%, from fiscal 2002 to 2003 primarily due to a $32.9 million increase related
to additional personnel, a $22.2 million increase associated with lab equipment, software licenses, maintenance fees and depreciation
charges, a $4.5 million increase related to engineering costs to develop next generation products, and a $10.5 million increase in
facilities costs due to the move into a new building at our headquarters and a full year of occupation in all headquarter buildings as