Lululemon 2011 Annual Report Download - page 42
Download and view the complete annual report
Please find page 42 of the 2011 Lululemon annual report below. You can navigate through the pages in the report by either clicking on the pages listed below, or by using the keyword search tool below to find specific information within the annual report.-
 1
1 -
2
-
3
-
4
-
5
-
6
-
7
-
8
-
9
-
10
-
11
-
12
-
13
-
14
-
15
-
16
-
17
-
18
-
19
-
20
-
21
-
22
-
23
-
24
-
25
-
26
-
27
-
28
-
29
-
30
-
31
-
 32
32 -
 33
33 -
 34
34 -
 35
35 -
 36
36 -
 37
37 -
 38
38 -
 39
39 -
 40
40 -
 41
41 -
 42
42 -
 43
43 -
 44
44 -
 45
45 -
 46
46 -
 47
47 -
 48
48 -
 49
49 -
 50
50 -
 51
51 -
 52
52 -
53
-
54
-
55
-
56
-
57
-
58
-
59
-
60
-
61
-
62
-
63
-
64
-
65
-
66
-
67
-
68
-
69
-
70
-
71
-
72
-
73
-
74
-
75
-
76
-
77
-
78
-
79
-
80
-
81
-
82
-
83
-
84
-
85
-
86
-
87
-
88
-
89
-
90
-
91
-
92
-
93
-
94
 |
 |

Table of Contents
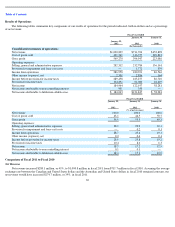
of our full year gross profit in the fourth quarter in fiscal 2011, fiscal 2010 and fiscal 2009, respectively. Despite the fact that we have
experienced a significant amount of our net revenue and gross profit in the fourth quarter of our fiscal year, we believe that the true extent of the
seasonality or cyclical nature of our business may have been overshadowed by our rapid growth to date. As our expected growth rate slows, we
believe that we will experience fourth quarter gross profits as a percentage of full year gross profits as high, or higher, than in the current year.
The level of our working capital reflects the seasonality of our business. We expect inventory, accounts payable and accrued expenses to
be higher in the third and fourth quarters in preparation for the holiday selling season. Because our products are sold primarily through our
stores, order backlog is not material to our business.
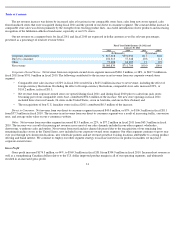
Liquidity and Capital Resources
Our primary sources of liquidity are our current balances of cash and cash equivalents, cash flows from operations and borrowings
available under our revolving credit facility. Our primary cash needs are capital expenditures for opening new stores and remodeling existing
stores, making information technology system enhancements and funding working capital requirements. Cash and cash equivalents in excess of
our needs are held in interest bearing accounts with financial institutions.
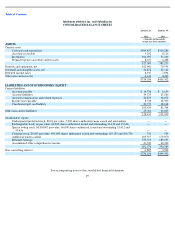
As of January 29, 2012, our working capital (excluding cash and cash equivalents) was $3.6 million and our cash and cash equivalents
were $409.4 million.
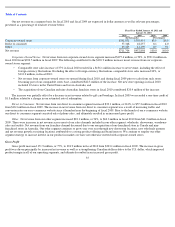
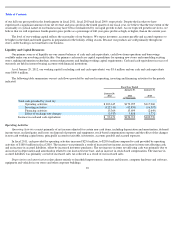
The following table summarizes our net cash flows provided by and used in operating, investing and financing activities for the periods
indicated:
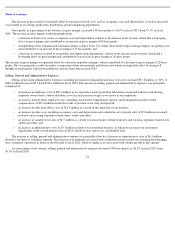
Operating Activities
Operating Activities consist primarily of net income adjusted for certain non-cash items, including depreciation and amortization, deferred
income taxes, realized gains and losses on disposal of property and equipment, stock-based compensation expense and the effect of the changes
in non-cash working capital items, principally accounts receivable, inventories, accounts payable and accrued expenses.
In fiscal 2011, cash provided by operating activities increased $23.6 million, to $203.6 million compared to cash provided by operating
activities of $180.0 million in fiscal 2010. The increase was primarily a result of increased net income, an increase in items not affecting cash,
and an increase in accrued liabilities, offset by increased inventory purchases. The net increase in items not affecting cash was primarily due to
an increase in depreciation and amortization related to our increased store base, and an increase in stock-based compensation. The increase in
accrued liabilities was primarily a result of increased sales tax collected as a result of our increased sales.
Depreciation and amortization relate almost entirely to leasehold improvements, furniture and fixtures, computer hardware and software,
equipment and vehicles in our stores and other corporate buildings.
39
Fiscal Year Ended
January 29,
2012
January 30,
2011
January 31,
2010
(In thousands)
Total cash provided by (used in):
Operating activities
$
203,615
$
179,995
$
117,960
Investing activities
(122,311
)
(42,839
)
(16,307
)
Financing activities
15,364
13,699
(2,649
)
Effect of exchange rate changes
(3,517
)
5,858
3,772
Increase in cash and cash equivalents
$
93,151
$
156,713
$
102,776