Lululemon 2011 Annual Report Download - page 33
Download and view the complete annual report
Please find page 33 of the 2011 Lululemon annual report below. You can navigate through the pages in the report by either clicking on the pages listed below, or by using the keyword search tool below to find specific information within the annual report.-
 1
1 -
2
-
3
-
4
-
5
-
6
-
7
-
8
-
9
-
10
-
11
-
12
-
13
-
14
-
15
-
16
-
17
-
18
-
19
-
20
-
21
-
22
-
 23
23 -
 24
24 -
 25
25 -
 26
26 -
 27
27 -
 28
28 -
 29
29 -
 30
30 -
 31
31 -
 32
32 -
 33
33 -
 34
34 -
 35
35 -
 36
36 -
 37
37 -
 38
38 -
 39
39 -
 40
40 -
 41
41 -
 42
42 -
 43
43 -
44
-
45
-
46
-
47
-
48
-
49
-
50
-
51
-
52
-
53
-
54
-
55
-
56
-
57
-
58
-
59
-
60
-
61
-
62
-
63
-
64
-
65
-
66
-
67
-
68
-
69
-
70
-
71
-
72
-
73
-
74
-
75
-
76
-
77
-
78
-
79
-
80
-
81
-
82
-
83
-
84
-
85
-
86
-
87
-
88
-
89
-
90
-
91
-
92
-
93
-
94
 |
 |

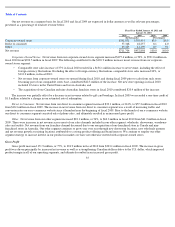
Table of Contents
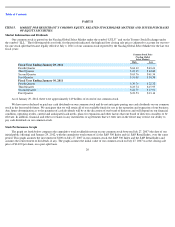
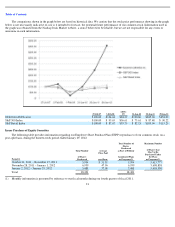
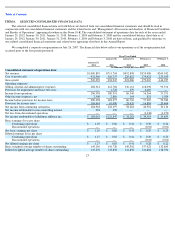
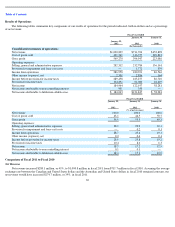
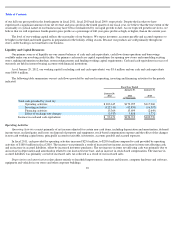
Results of Operations
The following tables summarize key components of our results of operations for the periods indicated, both in dollars and as a percentage
of net revenue:
Comparison of Fiscal 2011 to Fiscal 2010
Net Revenue
Net revenue increased $289.1 million, or 41%, to $1,000.8 million in fiscal 2011 from $711.7 million in fiscal 2010. Assuming the average
exchange rate between the Canadian and United States dollars and the Australian and United States dollars in fiscal 2010 remained constant, our
net revenue would have increased $274.7 million, or 39%, in fiscal 2011.
30
Fiscal Year Ended
January 29,
2012
January 30,
2011
January 31,
2010
(In thousands)
Consolidated statements of operations:
Net revenue
$
1,000,839
$
711,704
$
452,898
Cost of goods sold
431,569
316,757
229,812
Gross profit
569,270
394,947
223,086
Operating expenses:
Selling, general and administrative expenses
282,312
212,784
136,161
Provision for impairment and lease exit costs
—
1,772
379
Income from operations
286,958
180,391
86,546
Other income (expense), net
2,500
2,886
164
Income before provision for income taxes
289,458
183,277
86,710
Provision for income taxes
104,494
61,080
28,429
Net income
184,964
122,197
58,281
Net income attributable to non
-
controlling interest
901
350
—
Net income attributable to lululemon athletica inc.
$
184,063
$
121,847
$
58,281
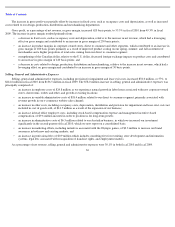
Fiscal Year Ended
January 29,
2012
January 30,
2011
January 31,
2010
(% of net revenue)
Net revenue
100.0
100.0
100.0
Cost of goods sold
43.1
44.5
50.7
Gross profit
56.9
55.5
49.3
Operating expenses:
Selling, general and administrative expenses
28.2
29.9
30.1
Provision for impairment and lease exit costs
—
0.2
0.1
Income from operations
28.7
25.4
19.1
Other income (expense), net
0.2
0.4
0.1
Income before provision for income taxes
28.9
25.8
19.2
Provision for income taxes
10.4
8.6
6.3
Net income
18.5
17.2
12.9
Net income attributable to non
-
controlling interest
0.1
0.1
—
Net income attributable to lululemon athletica inc.
18.4
17.1
12.9