Lululemon 2011 Annual Report Download - page 23
Download and view the complete annual report
Please find page 23 of the 2011 Lululemon annual report below. You can navigate through the pages in the report by either clicking on the pages listed below, or by using the keyword search tool below to find specific information within the annual report.-
 1
1 -
2
-
3
-
4
-
5
-
6
-
7
-
8
-
9
-
10
-
11
-
12
-
 13
13 -
 14
14 -
 15
15 -
 16
16 -
 17
17 -
 18
18 -
 19
19 -
 20
20 -
 21
21 -
 22
22 -
 23
23 -
 24
24 -
 25
25 -
 26
26 -
 27
27 -
 28
28 -
 29
29 -
 30
30 -
 31
31 -
 32
32 -
 33
33 -
34
-
35
-
36
-
37
-
38
-
39
-
40
-
41
-
42
-
43
-
44
-
45
-
46
-
47
-
48
-
49
-
50
-
51
-
52
-
53
-
54
-
55
-
56
-
57
-
58
-
59
-
60
-
61
-
62
-
63
-
64
-
65
-
66
-
67
-
68
-
69
-
70
-
71
-
72
-
73
-
74
-
75
-
76
-
77
-
78
-
79
-
80
-
81
-
82
-
83
-
84
-
85
-
86
-
87
-
88
-
89
-
90
-
91
-
92
-
93
-
94
 |
 |

Table of Contents
PART II
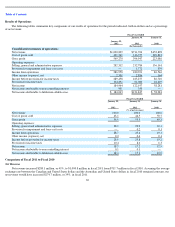
Market Information and Dividends
Our common stock is quoted on the Nasdaq Global Select Market under the symbol “LULU” and on the Toronto Stock Exchange under
the symbol “LLL.” The following table sets forth, for the periods indicated, the high and low closing sale prices (adjusted to account for our two-
for-
one stock split that became legally effective July 1, 2011) of our common stock reported by the Nasdaq Global Select Market for the last two
fiscal years:
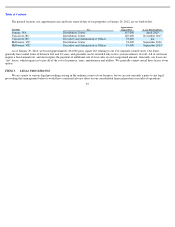
As of January 29, 2012, there were approximately 149 holders of record of our common stock.
We have never declared or paid any cash dividends on our common stock and do not anticipate paying any cash dividends on our common
stock in the foreseeable future. We anticipate that we will retain all of our available funds for use in the operation and expansion of our business.
Any future determination as to the payment of cash dividends will be at the discretion of our board of directors and will depend on our financial
condition, operating results, current and anticipated cash needs, plans for expansion and other factors that our board of directors considers to be
relevant. In addition, financial and other covenants in any instruments or agreements that we enter into in the future may restrict our ability to
pay cash dividends on our common stock.
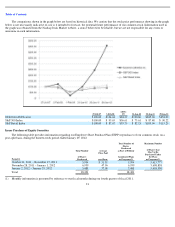
Stock Performance Graph
The graph set forth below compares the cumulative total stockholder return on our common stock between July 27, 2007 (the date of our
initial public offering) and January 29, 2012, with the cumulative total return of (i) the S&P 500 Index and (ii) S&P Retail Index, over the same
period. This graph assumes the investment of $100 on July 27, 2007 in our common stock, the S&P 500 Index and the S&P Retail Index and
assumes the reinvestment of dividends, if any. The graph assumes the initial value of our common stock on July 27, 2007 was the closing sale
price of $14.00 per share, on a post-split basis.
20
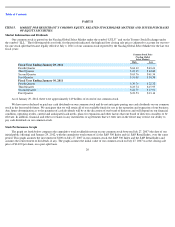
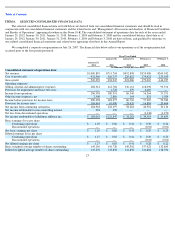
ITEM 5.
MARKET FOR REGISTRANT
’
S COMMON EQUITY, RELATED STOCKHOLDER MATTERS AND ISSUER PURCHASES
OF EQUITY SECURITIES
Common Stock Price
(Nasdaq Global
Select Market)
High
Low
Fiscal Year Ending January 29, 2012
Fourth Quarter
$
64.12
$
43.61
Third Quarter
$
62.15
$
44.80
Second Quarter
$
63.76
$
41.54
First Quarter
$
51.08
$
34.34
Fiscal Year Ending January 30, 2011
Fourth Quarter
$
36.76
$
22.32
Third Quarter
$
23.74
$
15.95
Second Quarter
$
22.79
$
17.91
First Quarter
$
22.53
$
13.14