Lululemon 2011 Annual Report Download - page 37
Download and view the complete annual report
Please find page 37 of the 2011 Lululemon annual report below. You can navigate through the pages in the report by either clicking on the pages listed below, or by using the keyword search tool below to find specific information within the annual report.-
 1
1 -
2
-
3
-
4
-
5
-
6
-
7
-
8
-
9
-
10
-
11
-
12
-
13
-
14
-
15
-
16
-
17
-
18
-
19
-
20
-
21
-
22
-
23
-
24
-
25
-
26
-
 27
27 -
 28
28 -
 29
29 -
 30
30 -
 31
31 -
 32
32 -
 33
33 -
 34
34 -
 35
35 -
 36
36 -
 37
37 -
 38
38 -
 39
39 -
 40
40 -
 41
41 -
 42
42 -
 43
43 -
 44
44 -
 45
45 -
 46
46 -
 47
47 -
48
-
49
-
50
-
51
-
52
-
53
-
54
-
55
-
56
-
57
-
58
-
59
-
60
-
61
-
62
-
63
-
64
-
65
-
66
-
67
-
68
-
69
-
70
-
71
-
72
-
73
-
74
-
75
-
76
-
77
-
78
-
79
-
80
-
81
-
82
-
83
-
84
-
85
-
86
-
87
-
88
-
89
-
90
-
91
-
92
-
93
-
94
 |
 |

Table of Contents
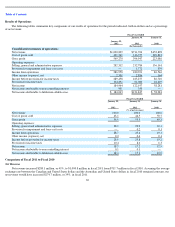
primarily due to an increase in expenses related to our head office growth of $14.8 million, which was largely related to the growth of our
information technology and human resources departments to support the growth of our business. Income from operations also increased as a
result of increased stock-based compensation expense of $2.2 million, an increase in foreign exchange losses of $1.2 million, and increased
depreciation and amortization expense of $0.5 million. The increase was partially offset by a decreased provision for impairment and lease exit
costs of $1.8 million. General corporate expenses are expected to continue to increase in future years as we grow our overall business and require
increased efforts at our head office to support our corporate-owned stores, franchises and other segments.
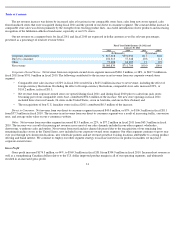
Other Income (Expense), Net
Other income (expense), net decreased $0.4 million, to $2.5 million in fiscal 2011 from $2.9 million in fiscal 2010. The decrease was
primarily a result of re-measuring our 13 percent non-controlling equity investment in Australia immediately prior to obtaining control of the
business, which led to a $1.8 million gain on investment in fiscal 2010. This was offset by increased interest income earned in fiscal 2011
compared to fiscal 2010 on our increased cash balances.
Provision for Income Taxes
Provision for income taxes increased $43.4 million, or 71%, to $104.5 million in fiscal 2011 from $61.1 million in fiscal 2010. In fiscal
2011, our effective tax rate was 36.1% compared to 33.3% in fiscal 2010. The higher effective tax rate was due to the proportional increase of
taxable income in the United States in fiscal 2011 compared to taxable income in Canada which is taxed at a rate lower than the US statutory rate
combined with the declining Canadian corporate tax rate. We expect this trend to continue as we expect to generate a higher proportion of our
future taxable income in the United States.
We have not recorded deferred taxes on undistributed earnings and other temporary differences of our Canadian subsidiary which are
considered to be indefinitely reinvested. If management’s intentions with respect to these undistributed earnings and other temporary differences
were to change in the future, deferred taxes may need to be provided that could materially impact our financial results.
Net Income
Net income increased $62.2 million, or 51%, to $184.1 million in fiscal 2011 from $121.8 million in fiscal 2010. The increase in net
income in fiscal 2011 was primarily due to a $174.3 million increase in gross profit resulting from sales growth at existing and additional
corporate-owned stores opened during fiscal 2011 and increasing traffic on our e-commerce website, offset by an increase of $67.8 million in
selling, general and administrative expenses, including provision for impairment and lease exit costs, an increase of $43.4 million in provision
for income taxes, and a $0.4 million decrease in other income (expense), net.
Comparison of Fiscal 2010 to Fiscal 2009
Net Revenue
Net revenue increased $258.8 million, or 57%, to $711.7 million in fiscal 2010 from $452.9 million in fiscal 2009. Assuming the average
exchange rate between the Canadian and United States dollars in fiscal 2009 remained constant, our net revenue would have increased
$229.6 million, or 51%, in fiscal 2010.
The net revenue increase was driven by increased sales at locations in our comparable stores base, sales from new stores and showrooms
opened, sales from franchised stores that were reacquired during fiscal 2010 and the growth of our e-commerce website sales included in our
direct to consumer segment. The constant dollar increase in comparable store sales was driven primarily by the strength of our existing product
lines, the successful introduction of new products and increasing recognition of the lululemon athletica brand name, especially at our U.S. stores.
34