Lululemon 2011 Annual Report Download - page 32
Download and view the complete annual report
Please find page 32 of the 2011 Lululemon annual report below. You can navigate through the pages in the report by either clicking on the pages listed below, or by using the keyword search tool below to find specific information within the annual report.-
 1
1 -
2
-
3
-
4
-
5
-
6
-
7
-
8
-
9
-
10
-
11
-
12
-
13
-
14
-
15
-
16
-
17
-
18
-
19
-
20
-
21
-
 22
22 -
 23
23 -
 24
24 -
 25
25 -
 26
26 -
 27
27 -
 28
28 -
 29
29 -
 30
30 -
 31
31 -
 32
32 -
 33
33 -
 34
34 -
 35
35 -
 36
36 -
 37
37 -
 38
38 -
 39
39 -
 40
40 -
 41
41 -
 42
42 -
43
-
44
-
45
-
46
-
47
-
48
-
49
-
50
-
51
-
52
-
53
-
54
-
55
-
56
-
57
-
58
-
59
-
60
-
61
-
62
-
63
-
64
-
65
-
66
-
67
-
68
-
69
-
70
-
71
-
72
-
73
-
74
-
75
-
76
-
77
-
78
-
79
-
80
-
81
-
82
-
83
-
84
-
85
-
86
-
87
-
88
-
89
-
90
-
91
-
92
-
93
-
94
 |
 |

Table of Contents
circumstances indicate that full recoverability of net assets through future cash flows is in question. Factors used in the evaluation include, but
are not limited to, management’s plans for future operations, recent operating results and projected cash flows.
Other income (expense), net includes interest earned on our cash balances and our advances to franchise, interest costs associated with our
credit facilities and with letters of credit drawn under these facilities for the purchase of merchandise and our share of the operations of our
investment in lululemon athletica australia PTY prior to obtaining control in fiscal 2010, including the remeasurement of our investment
immediately before obtaining control of the business. We expect to continue to generate interest income to the extent that our cash generated
from operations exceeds our cash used for investment. We have maintained relatively small outstanding balances on our credit facilities and
expect to continue to do so.
Provision for income taxes depends on the statutory tax rates in the countries where we sell our products. Historically we had generated
taxable income in Canada and we had generated tax losses in the United States. In fiscal 2010 we earned taxable income in the United States and
fully utilized any net operating losses available from prior periods. We anticipate continued growth in the United States and consequently foresee
and increase in taxable income reported. We have recorded deferred tax assets in respect of deductible temporary differences of 8.6 million.
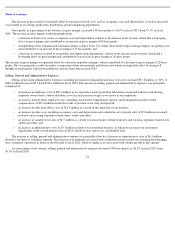
Several factors have contributed to our effective tax rate fluctuating from prior periods. Our effective tax rate for fiscal 2011 was 2.8%
higher than the effective rate for fiscal 2010 due primarily to the change in geographic mix of earnings. A larger percentage of our earnings in
fiscal 2011 were attributable to operations in the United States, where the statutory tax rate is generally higher than the tax rate on operations
outside of the United States. Secondly, in fiscal 2011 we incurred stock based compensation expense of $10.3 million compared to $7.3 million
in fiscal 2010, a portion of which were not deductible for tax purposes in Canada and the United States during these periods. Lastly, the
Canadian corporate tax rate decreased to 28.7% in fiscal 2011 from 31.6% in fiscal 2010. Our effective tax rate in fiscal 2011 was 36.1%,
compared to 33.3% in fiscal 2010 and 33% in fiscal 2009.
We anticipate that in the future we may start to sell our products directly to some customers located outside of Canada, the United States,
Australia and New Zealand, in which case we would become subject to taxation based on the foreign statutory rates in the countries where these
sales take place and our effective tax rate could fluctuate accordingly.
29