Lululemon 2011 Annual Report Download - page 38
Download and view the complete annual report
Please find page 38 of the 2011 Lululemon annual report below. You can navigate through the pages in the report by either clicking on the pages listed below, or by using the keyword search tool below to find specific information within the annual report.-
 1
1 -
2
-
3
-
4
-
5
-
6
-
7
-
8
-
9
-
10
-
11
-
12
-
13
-
14
-
15
-
16
-
17
-
18
-
19
-
20
-
21
-
22
-
23
-
24
-
25
-
26
-
27
-
 28
28 -
 29
29 -
 30
30 -
 31
31 -
 32
32 -
 33
33 -
 34
34 -
 35
35 -
 36
36 -
 37
37 -
 38
38 -
 39
39 -
 40
40 -
 41
41 -
 42
42 -
 43
43 -
 44
44 -
 45
45 -
 46
46 -
 47
47 -
 48
48 -
49
-
50
-
51
-
52
-
53
-
54
-
55
-
56
-
57
-
58
-
59
-
60
-
61
-
62
-
63
-
64
-
65
-
66
-
67
-
68
-
69
-
70
-
71
-
72
-
73
-
74
-
75
-
76
-
77
-
78
-
79
-
80
-
81
-
82
-
83
-
84
-
85
-
86
-
87
-
88
-
89
-
90
-
91
-
92
-
93
-
94
 |
 |

Table of Contents
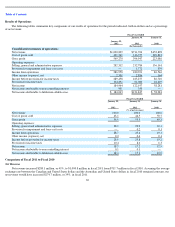
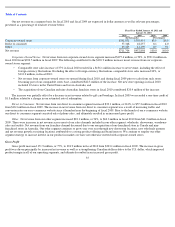
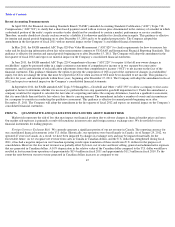
Our net revenue on a segment basis for fiscal 2010 and fiscal 2009 are expressed in dollar amounts as well as relevant percentages,
presented as a percentage of total net revenue below.
Corporate-Owned Stores. Net revenue from our corporate-owned stores segment increased $197.6 million, or 50%, to $591.0 million in
fiscal 2010 from $393.5 million in fiscal 2009. The following contributed to the $196.9 million increase in net revenue from our corporate-
owned stores segment:
The increase was partially offset by a decrease in net revenue related to gift card breakage. In fiscal 2009 we recorded a one-time credit of
$1.3 million related to a change in our estimated rate of redemption.
Direct to Consumer. Net revenue from our direct to consumer segment increased $39.1 million, or 214%, to $57.3 million in fiscal 2010
from $18.3 million in fiscal 2009. The increase in net revenue from our direct to consumer segment was a result of increasing traffic and
conversion rates on our e-commerce website since it launched near the beginning of fiscal 2009. Prior to the launch of our e-commerce website,
our direct to consumer segment consisted only of phone sales, and ultimately resulted in an increased gross profit.
Other. Net revenue from our other segment increased $22.1 million, or 54%, to $63.3 million in fiscal 2010 from $41.2 million in fiscal
2009. There were increases in net revenue across most of our sales channels included in our other segment: wholesale, showrooms, warehouse
sales and outlets. Net revenue from our franchise channel decreased due to our reacquisition of one franchised store in Canada and nine
franchised stores in Australia. Our other segment continues to grow year over year through new showroom locations, new wholesale partners
and net revenue growth at existing locations attributable to a strong product offering and brand interest. We continue to employ our other
segment strategy to increase interest in our product in markets we have not otherwise entered with corporate-owned stores.
Gross Profit
Gross profit increased 171.9 million, or 77%, to 394.9 million in fiscal 2010 from $223.1 million in fiscal 2009. The increase in gross
profit was driven principally by increased net revenue as well as a strengthening Canadian dollar relative to the U.S. dollar, which improved
product margin in all of our operating segments, and ultimately resulted in an increased gross profit.
35
Fiscal Year Ended January 30, 2011 and
January 31, 2010
2010
2009
2010
2009
(In thousands)
(Percentages)
Corporate
-
owned stores
$
591,031
$
393,451
83.0
86.9
Direct to consumer
57,348
18,257
8.1
4.0
Other
63,325
41,190
8.9
9.1
Net revenue
$
711,704
$
452,898
100.0
100.0
•
Comparable store sales increase of 37% in fiscal 2010 resulted in a $136.1 million increase to net revenue, including the effect of
foreign currency fluctuations. Excluding the effect of foreign currency fluctuations, comparable store sales increased 30%, or
$112.2 million, in fiscal 2010;
•
Net revenue from corporate
-
owned stores we opened during fiscal 2010, and during fiscal 2009 prior to sales from such stores
becoming part of our comparable stores base, contributed $42.3 million of the increase. Net new store openings in fiscal 2010
included 12 stores in the United States and two in Australia; and
•
The acquisition of one Canadian and nine Australian franchise stores in fiscal 2010 contributed $20.4 million of the increase.