Loreal 2014 Annual Report Download - page 12
Download and view the complete annual report
Please find page 12 of the 2014 Loreal annual report below. You can navigate through the pages in the report by either clicking on the pages listed below, or by using the keyword search tool below to find specific information within the annual report.
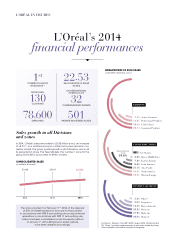
BREAKDOWN OF 2014 SALES
(Cosmetics Divisions, as %)
1st
COSMETICS GROUP
WORLDWIDE
(1)
EMPLOYEES
78,600
32
COMPLEMENTARY BRANDS
AN INTERNATIONAL
PORTFOLIO OF
501
PATENTS REGISTERED IN 2014
BILLION EUROS OF SALES
IN 2014
22.53
Sales growth in all Divisions
and zones
The announcement on February 11th, 2014, of the disposal
of 50% of Galderma leads to account for this business
inaccordance with IFRS 5 accounting rule on discontinued
operations. In accordance with IFRS 11 accounting rule,
Innéov has been consolidated under the equity method
of January 1st, 2014. All figures for earlier periods
have been restated accordingly. (1) Source: “Beauty’s Top 100” WWD, August 2014. (2) Like-for-like.
(3) “Other” includes hygiene products and sales made by Ameri-
can distributors with brands outside of the group.
7.7% Active Cosmetics
14.0% Professional Products
28.6% L’Oréal Luxe
49.7% Consumer Products
DIVISIONS
4.6% Other (3)
9.8% Fragrances
13.2% Hair colourants
20.5% Haircare
21.9% Make-up
30.0% Skincare
BUSINESS SEGMENTS
L’Oréal’s 2014
financial performances
L’ORÉAL IN FIGURES
In 2014, L’Oréal’s sales amounted to 22.53 billion euros, an increase
of +3.7%(2). In a volatile economic context and a less dynamic cos-
metics market, the group posted growth in all its Divisions and in all
its geographic zones. The New Markets, the number 1 zone for the
group since 2012, accounted for 39.6% of sales.
CONSOLIDATED SALES
(in millions of euros)
20142012 2013
22,532
22,12421,638
2.6% Africa, Middle East
7.3% Eastern Europe
8.6% Latin America
21.1% Asia, Pacific
24.9% North America
35.5% Western Europe
New Markets
Total
39.6% New Markets
GEOGRAPHIC ZONES
130
COUNTRIES
MORE THAN


