Loreal 2012 Annual Report Download - page 90
Download and view the complete annual report
Please find page 90 of the 2012 Loreal annual report below. You can navigate through the pages in the report by either clicking on the pages listed below, or by using the keyword search tool below to find specific information within the annual report.-
 1
1 -
2
-
3
-
4
-
5
-
6
-
7
-
8
-
9
-
10
-
11
-
12
-
13
-
14
-
15
-
16
-
17
-
18
-
19
-
20
-
21
-
22
-
23
-
24
-
25
-
26
-
27
-
28
-
29
-
30
-
31
-
32
-
33
-
34
-
35
-
36
-
37
-
38
-
39
-
40
-
41
-
42
-
43
-
44
-
45
-
46
-
47
-
48
-
49
-
50
-
51
-
52
-
53
-
54
-
55
-
56
-
57
-
58
-
59
-
60
-
61
-
62
-
63
-
64
-
65
-
66
-
67
-
68
-
69
-
70
-
71
-
72
-
73
-
74
-
75
-
76
-
77
-
78
-
79
-
 80
80 -
 81
81 -
 82
82 -
 83
83 -
 84
84 -
 85
85 -
 86
86 -
 87
87 -
 88
88 -
 89
89 -
 90
90 -
 91
91 -
 92
92 -
 93
93 -
 94
94 -
 95
95 -
 96
96
 |
 |
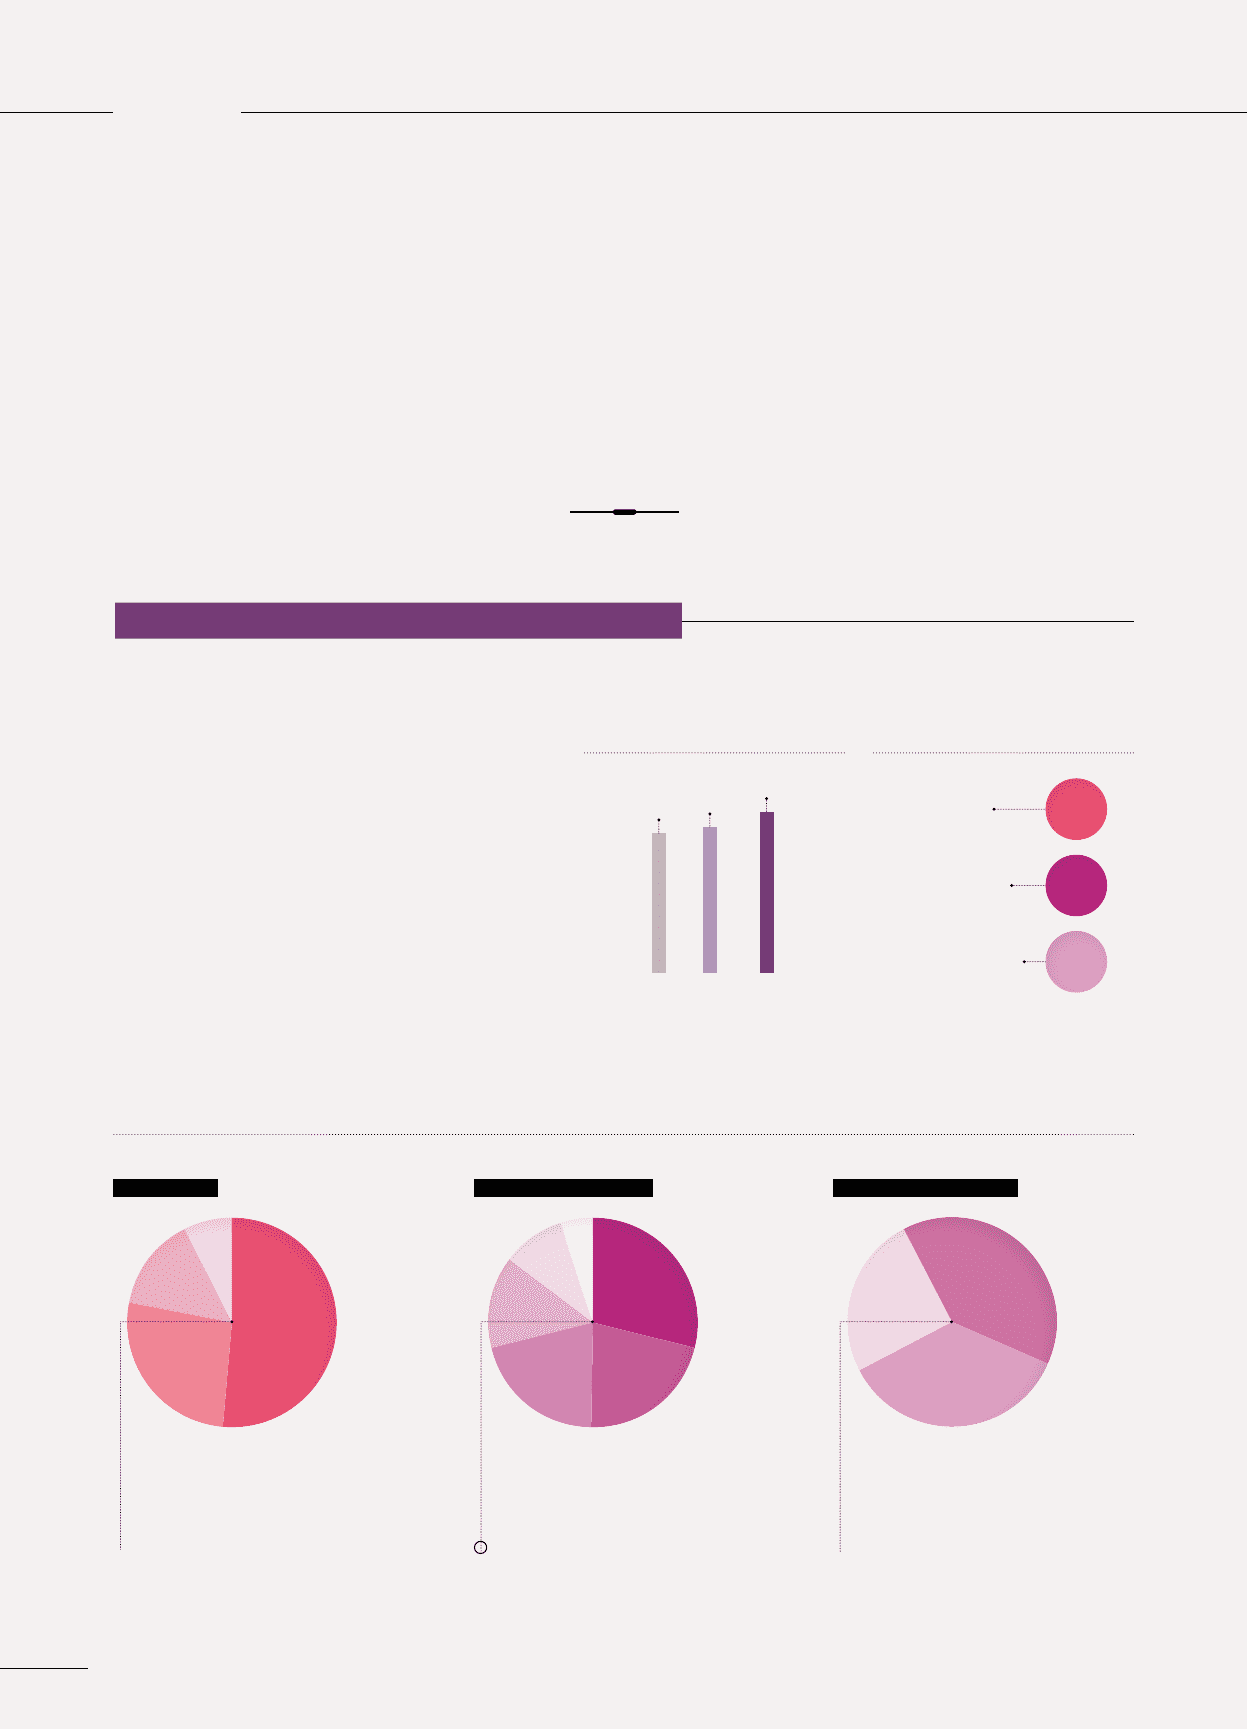
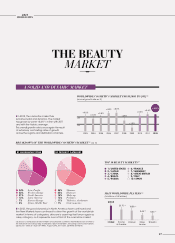
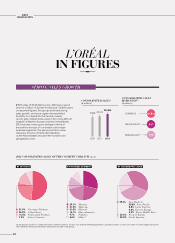
2012 CONSOLIDATED SALES OF THE COSMETICS BRANCH (as %)
(1) The group’s business is composed of the cosmetics branch, THE BODY SHOP and the dermatology branch. (2) Group share, i.e. 50%. (3) “Other” includes hygiene products,
sales made by American distributors with brands outside of the group.
❚ With sales at 22.46 billion euros, 2012 was a good
year for L’Oréal: +5.5% like-for-like and +10.4% based
on reported figures. The group achieved strong
sales growth, and once again demonstrated
its ability to outperform the beauty market,
and to gain market share, even in the more difficult
markets of Western Europe and the United States.
2012 was also a very good vintage in terms of
innovations in each of our divisions and major
business segments. The group reached a new
milestone in terms of internationalisation,
as the New Markets became the number one
geographic zone.
CONSOLIDATED SALES
BY BRANCH (1)
(€ millions)
CONSOLIDATED SALES
(€ millions)
STRONG SALES GROWTH
BY DIVISION BY BUSINESS SEGMENT BY GEOGRAPHIC ZONE
COSMETICS 20,812
THE BODY SHOP 855
DERMATOLOGY
(2) 796
IN FIGURES
L’OR É A L
22,463
2012
20,343
2011
19,496
2010
● 51.5% Consumer Products
● 26.8% L’Oréal Luxe
● 14.4% Professional Products
● 7.3% Active Cosmetics
● 29.1% Skincare
● 21.5% Make-up
● 21.0% Haircare
● 14.1% Hair colourants
● 9.7% Perfumes
● 4.6% Other
(3)
● 39.4% New Markets:
20.6% Asia, Pacific
8.8% Latin America
6.8% Eastern Europe
3.3% Africa, Middle East
● 35.6% Western Europe
● 25.0% North America
2012
HIGHLIGHTS
88