Loreal 2012 Annual Report Download - page 89
Download and view the complete annual report
Please find page 89 of the 2012 Loreal annual report below. You can navigate through the pages in the report by either clicking on the pages listed below, or by using the keyword search tool below to find specific information within the annual report.-
 1
1 -
2
-
3
-
4
-
5
-
6
-
7
-
8
-
9
-
10
-
11
-
12
-
13
-
14
-
15
-
16
-
17
-
18
-
19
-
20
-
21
-
22
-
23
-
24
-
25
-
26
-
27
-
28
-
29
-
30
-
31
-
32
-
33
-
34
-
35
-
36
-
37
-
38
-
39
-
40
-
41
-
42
-
43
-
44
-
45
-
46
-
47
-
48
-
49
-
50
-
51
-
52
-
53
-
54
-
55
-
56
-
57
-
58
-
59
-
60
-
61
-
62
-
63
-
64
-
65
-
66
-
67
-
68
-
69
-
70
-
71
-
72
-
73
-
74
-
75
-
76
-
77
-
78
-
 79
79 -
 80
80 -
 81
81 -
 82
82 -
 83
83 -
 84
84 -
 85
85 -
 86
86 -
 87
87 -
 88
88 -
 89
89 -
 90
90 -
 91
91 -
 92
92 -
 93
93 -
 94
94 -
 95
95 -
 96
96
 |
 |
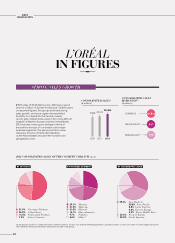
L’Oréal Procter
& Gamble Estée
Lauder
Unilever Shiseido
BY GEOGRAPHIC ZONE BY PRODUCT CATEGORY
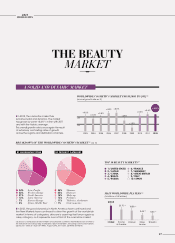
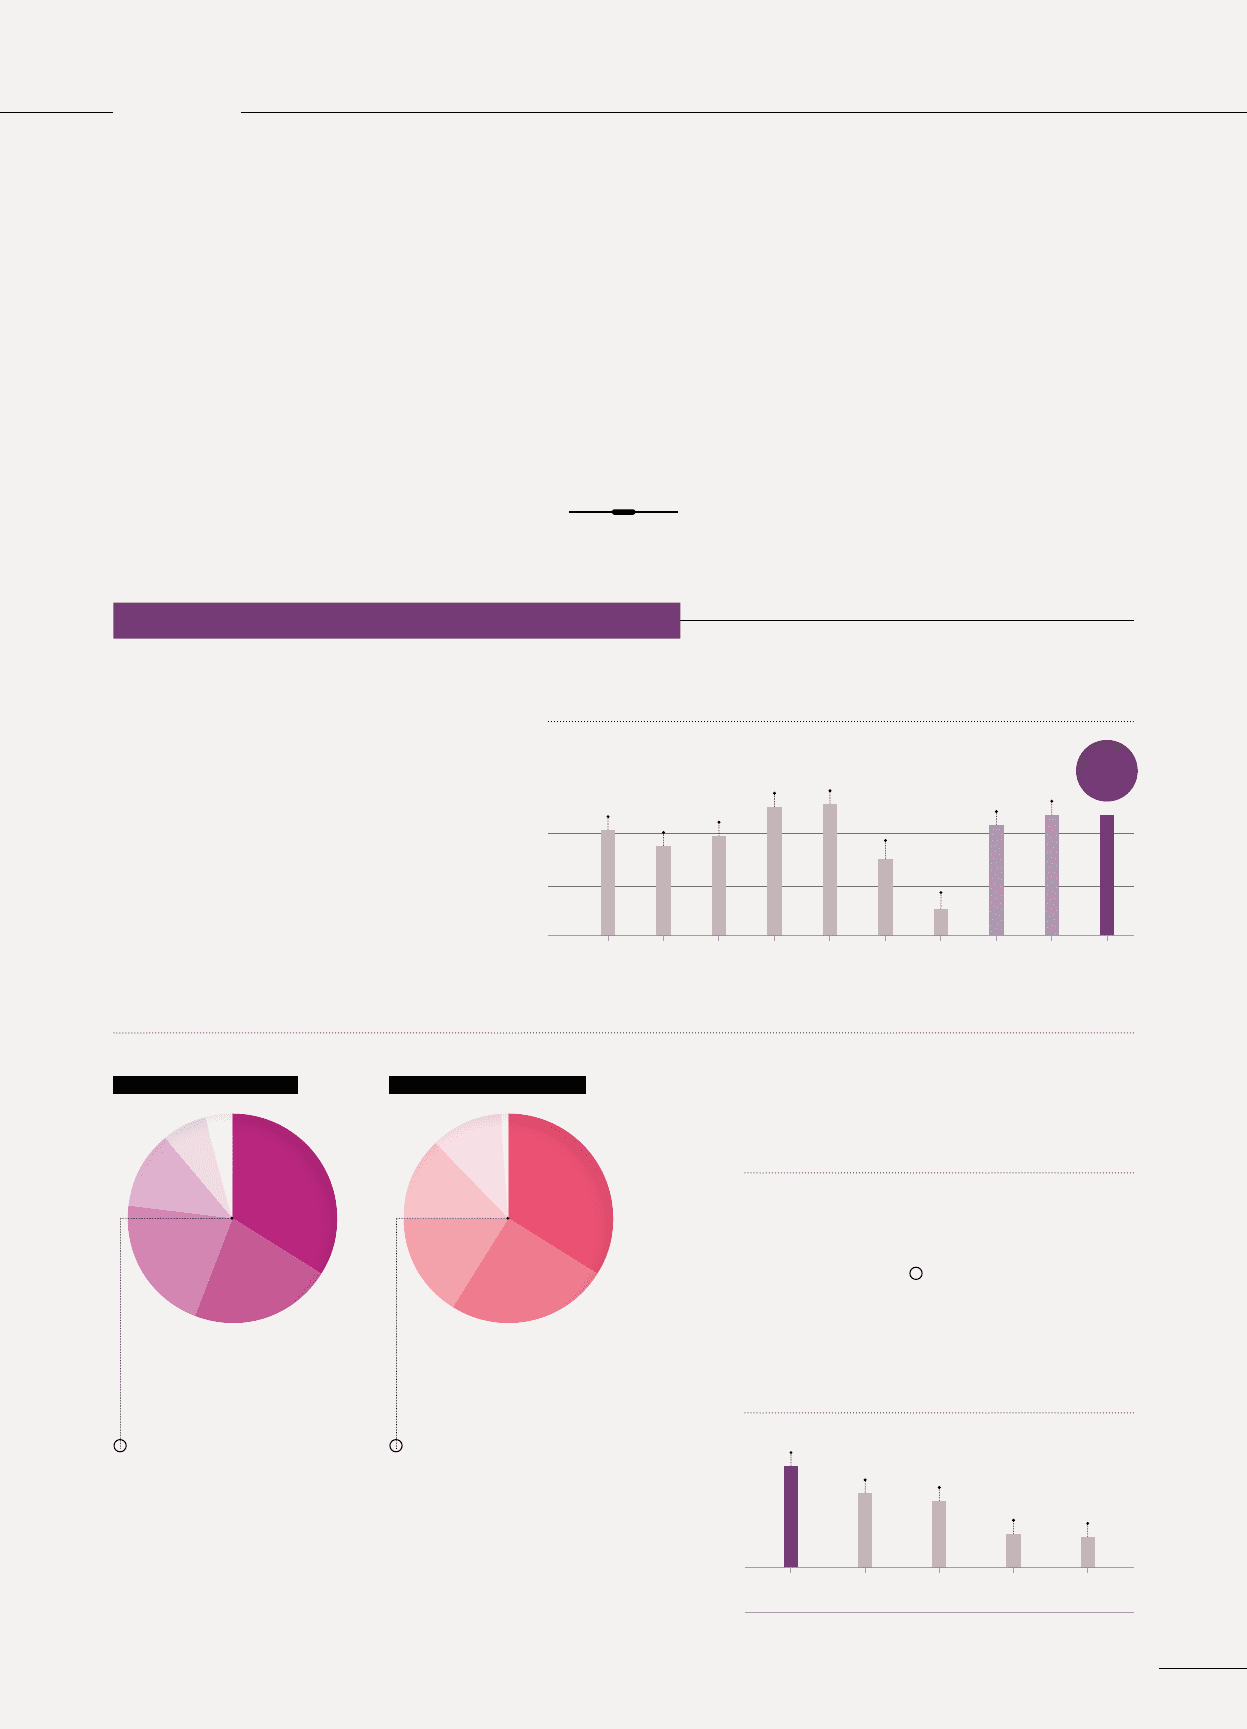
MARKET
THE BEAUTY
A SOLID AND DYNAMIC MARKET
+2%
+4%
WORLDWIDE COSMETICS MARKET FROM 2003 TO 2012 (1)
(annual growth rate as %)
20122003 2006 20092004 2007 20102005 2008 2011
+4.6%
❚ In 2012, the cosmetics market has
remained solid and dynamic. The market
has grown by some +4.6%(1), in line with 2011
and with the historic average.
This overall growth rate is once again the result
of extremely contrasting rates of growth
across the regions and distribution channels.
BREAKDOWN OF THE WORLDWIDE COSMETICS MARKET (1) (as %)
MAIN WORLDWIDE PLAYERS (2)
(in billions of US dollars)
(1) Source: L’Oréal provisional estimates of worldwide cosmetics market based on net manu-
facturer prices excluding soap, toothpaste, razors and blades. Excluding currency fluctuations.
(2) Source: “Beauty’s Top 100” WWD, August 2012, 2011 sales. (3) WWD Estimates.
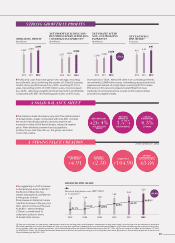
❚ In 2012, the good dynamics in North America have continued and
the New Markets have continued to drive the growth of the worldwide
market. In terms of categories, skincare is asserting itself once again as
a key category, as it represents over a third of the cosmetics market.
TOP 10 BEAUTY MARKETS (1)
● 1 / UNITED STATES
● 2 / JAPAN
● 3 / CHINA
● 4 / BRAZIL
● 5 / RUSSIA
● 6 / FRANCE
● 7 / GERMANY
● 8 / GREAT BRITAIN
● 9 / ITALY
● 10 / SPAIN
● 34% Asia, Pacific
● 22% Western Europe
● 21% North America
● 12% Latin America
● 7% Eastern Europe
● 4% Africa, Middle East
● 34% Skincare
● 25% Haircare
● 16% Make-up
● 13% Perfumes
● 11% Toiletries, deodorants
● 1% Oral cosmetics 28.33
20.70 (3) 18.58 (3)
9.44 (3) 8.53 (3)
+4.0% +3.4% +3.8%
+4.9% +5.0%
+2.9%
+1.0%
+4.2% +4.6%
2012
HIGHLIGHTS
87