Logitech 2004 Annual Report Download - page 79
Download and view the complete annual report
Please find page 79 of the 2004 Logitech annual report below. You can navigate through the pages in the report by either clicking on the pages listed below, or by using the keyword search tool below to find specific information within the annual report.-
 1
1 -
2
-
3
-
4
-
5
-
6
-
7
-
8
-
9
-
10
-
11
-
12
-
13
-
14
-
15
-
16
-
17
-
18
-
19
-
20
-
21
-
22
-
23
-
24
-
25
-
26
-
27
-
28
-
29
-
30
-
31
-
32
-
33
-
34
-
35
-
36
-
37
-
38
-
39
-
40
-
41
-
42
-
43
-
44
-
45
-
46
-
47
-
48
-
49
-
50
-
51
-
52
-
53
-
54
-
55
-
56
-
57
-
58
-
59
-
60
-
61
-
62
-
63
-
64
-
65
-
66
-
67
-
68
-
 69
69 -
 70
70 -
 71
71 -
 72
72 -
 73
73 -
 74
74 -
 75
75 -
 76
76 -
 77
77 -
 78
78 -
 79
79 -
 80
80 -
 81
81 -
 82
82 -
 83
83 -
 84
84 -
 85
85 -
 86
86 -
 87
87 -
 88
88 -
 89
89 -
90
-
91
-
92
-
93
-
94
-
95
-
96
-
97
-
98
-
99
-
100
-
101
-
102
-
103
-
104
-
105
-
106
-
107
-
108
-
109
-
110
-
111
-
112
-
113
-
114
-
115
-
116
-
117
-
118
-
119
-
120
-
121
-
122
-
123
-
124
-
125
-
126
-
127
-
128
-
129
-
130
-
131
-
132
-
133
-
134
-
135
 |
 |

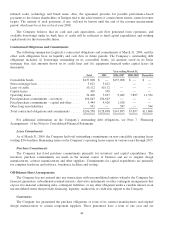
Liquidity and Capital Resources
Cash Balances, Available Borrowings, and Capital Resources
At March 31, 2004, net working capital was $410.9 million, compared to $325.7 million at March 31, 2003.
Cash and cash equivalents totaled $294.8 million, an increase of $76.0 million from March 31, 2003. The
increase in cash during fiscal year 2004 was primarily due to profitable operations.
The Company has financed its operations and capital requirements primarily through cash flow from
operations and, to a lesser extent, capital markets and bank borrowings. The Company’s normal short-term
liquidity and long-term capital resource requirements are provided from three sources: cash flow generated from
operations, cash and cash equivalents on hand and borrowings, as needed, under its credit facilities.
The Company had credit lines with several European and Asian banks totaling $71.7 million as of
March 31, 2004. As is common for businesses in European and Asian countries, these credit lines are
uncommitted and unsecured. Despite the lack of formal commitments from its banks, the Company believes that
these lines of credit will continue to be made available because of its long-standing relationships with these
banks. As of March 31, 2004, $61.6 million was available under these facilities.
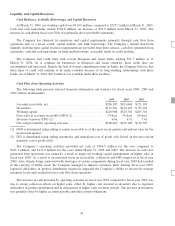
Cash Flow from Operating Activities
The following table presents selected financial information and statistics for fiscal years 2004, 2003 and
2002 (dollars in thousands):
2004 2003 2002
Accounts receivable, net .................................. $206,187 $181,644 $171,103
Inventories ............................................. $135,561 $124,123 $ 85,124
Working capital ......................................... $410,908 $325,701 $265,710
Days sales in accounts receivable (DSO) (1) ................... 53days 54days 60days
Inventory turnover (ITO) (2) ............................... 6.8x 6.7x 7.9x
Net cash provided by operating activities ..................... $166,460 $145,108 $112,595
(1) DSO is determined using ending accounts receivable as of the most recent quarter-end and net sales for the
most recent quarter.
(2) ITO is determined using ending inventories and annualized cost of goods sold (based on the most recent
quarterly cost of goods sold).
The Company’s operating activities provided net cash of $166.5 million for the year compared to
$145.1 million, and $112.6 million for the years ended March 31, 2003 and 2002. The increase in cash flow
generated from operations was primarily a result of improved working capital management on higher sales in
fiscal year 2004. As a result of an increased focus on receivables, collections and DSO improved in fiscal year
2004. Also, despite being confronted with shortages of certain components during fiscal year 2004 that resulted
in the carrying of buffer stock, the Company managed to improve inventory turns. During fiscal year 2003,
logistical difficulties in product distribution negatively impacted the Company’s ability to effectively manage
inventory levels and resulted in lower cash flow from operations.
The increase in cash provided by operating activities in fiscal year 2003 compared to fiscal year 2002 was
due to strong collection efforts on higher sales, offset by higher cash invested in inventory due to logistical
difficulties in product distribution and in anticipation of higher sales in future periods. The increase in inventory
was partially offset by higher accounts payable and other current obligations.
41