Logitech 2004 Annual Report Download - page 121
Download and view the complete annual report
Please find page 121 of the 2004 Logitech annual report below. You can navigate through the pages in the report by either clicking on the pages listed below, or by using the keyword search tool below to find specific information within the annual report.-
 1
1 -
2
-
3
-
4
-
5
-
6
-
7
-
8
-
9
-
10
-
11
-
12
-
13
-
14
-
15
-
16
-
17
-
18
-
19
-
20
-
21
-
22
-
23
-
24
-
25
-
26
-
27
-
28
-
29
-
30
-
31
-
32
-
33
-
34
-
35
-
36
-
37
-
38
-
39
-
40
-
41
-
42
-
43
-
44
-
45
-
46
-
47
-
48
-
49
-
50
-
51
-
52
-
53
-
54
-
55
-
56
-
57
-
58
-
59
-
60
-
61
-
62
-
63
-
64
-
65
-
66
-
67
-
68
-
69
-
70
-
71
-
72
-
73
-
74
-
75
-
76
-
77
-
78
-
79
-
80
-
81
-
82
-
83
-
84
-
85
-
86
-
87
-
88
-
89
-
90
-
91
-
92
-
93
-
94
-
95
-
96
-
97
-
98
-
99
-
100
-
101
-
102
-
103
-
104
-
105
-
106
-
107
-
108
-
109
-
110
-
 111
111 -
 112
112 -
 113
113 -
 114
114 -
 115
115 -
 116
116 -
 117
117 -
 118
118 -
 119
119 -
 120
120 -
 121
121 -
 122
122 -
 123
123 -
 124
124 -
 125
125 -
 126
126 -
 127
127 -
 128
128 -
 129
129 -
 130
130 -
 131
131 -
132
-
133
-
134
-
135
 |
 |

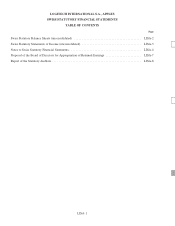
LOGITECH INTERNATIONAL S.A.
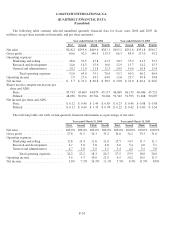
QUARTERLY FINANCIAL DATA
(Unaudited)
The following table contains selected unaudited quarterly financial data for fiscal years 2004 and 2003 (in
millions, except share amounts in thousands, and per share amounts):
Year ended March 31, 2004 Year ended March 31, 2003
First Second Third Fourth First Second Third Fourth
Net sales ............................ $218.2 $293.6 $409.6 $347.1 $195.1 $251.8 $351.8 $301.7
Grossprofit .......................... 60.6 92.5 140.5 115.3 66.3 85.9 117.0 95.2
Operating expenses:
Marketing and selling .............. 28.0 39.5 47.8 41.5 30.3 35.9 41.3 33.7
Research and development .......... 14.6 14.5 15.6 16.6 12.9 13.7 14.2 15.3
General and administrative .......... 10.2 11.0 11.8 12.3 10.5 10.6 10.8 11.4
Total operating expenses ....... 52.8 65.0 75.1 70.4 53.7 60.3 66.2 60.4
Operating income ..................... 7.9 27.4 65.3 44.9 12.6 25.7 50.8 34.8
Netincome .......................... $ 5.7 $ 21.2 $ 66.8 $ 38.5 $ 10.8 $ 21.0 $ 40.4 $ 26.6
Shares used to compute net income per
share and ADS:
Basic ........................... 45,743 45,669 44,879 45,117 46,065 46,133 46,046 45,721
Diluted ......................... 48,056 50,094 49,764 50,404 52,542 51,593 51,168 50,607
Net income per share and ADS:
Basic ........................... $ 0.12 $ 0.46 $ 1.49 $ 0.85 $ 0.23 $ 0.46 $ 0.88 $ 0.58
Diluted ......................... $ 0.12 $ 0.44 $ 1.35 $ 0.78 $ 0.22 $ 0.42 $ 0.80 $ 0.54
The following table sets forth certain quarterly financial information as a percentage of net sales:
Year ended March 31, 2004 Year ended March 31, 2003
First Second Third Fourth First Second Third Fourth
Net sales ............................ 100.0% 100.0% 100.0% 100.0% 100.0% 100.0% 100.0% 100.0%
Grossprofit ......................... 27.8 31.5 34.3 33.2 34.0 34.1 33.3 31.6
Operating expenses:
Marketing and selling .............. 12.8 13.4 11.6 12.0 15.5 14.3 11.7 11.1
Research and development .......... 6.7 5.0 3.8 4.8 6.6 5.4 4.0 5.1
General and administrative ......... 4.7 3.8 2.9 3.5 5.4 4.2 3.1 3.8
Total operating expenses ....... 24.2 22.2 18.3 20.3 27.5 23.9 18.8 20.0
Operating income ..................... 3.6 9.3 16.0 12.9 6.5 10.2 14.5 11.5
Netincome .......................... 2.6% 7.2% 16.3% 11.1% 5.5% 8.3% 11.5% 8.8%
F-24