JVC 2006 Annual Report Download - page 61
Download and view the complete annual report
Please find page 61 of the 2006 JVC annual report below. You can navigate through the pages in the report by either clicking on the pages listed below, or by using the keyword search tool below to find specific information within the annual report.-
 1
1 -
2
-
3
-
4
-
5
-
6
-
7
-
8
-
9
-
10
-
11
-
12
-
13
-
14
-
15
-
16
-
17
-
18
-
19
-
20
-
21
-
22
-
23
-
24
-
25
-
26
-
27
-
28
-
29
-
30
-
31
-
32
-
33
-
34
-
35
-
36
-
37
-
38
-
39
-
40
-
41
-
42
-
43
-
44
-
45
-
46
-
47
-
48
-
49
-
50
-
 51
51 -
 52
52 -
 53
53 -
 54
54 -
 55
55 -
 56
56 -
 57
57 -
 58
58 -
 59
59 -
 60
60 -
 61
61 -
 62
62 -
 63
63 -
 64
64
 |
 |

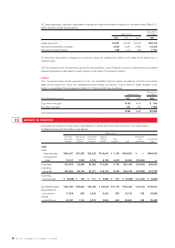
Victor Company of Japan, Limited 59
Millions of yen
Elimination and Consolidated
Japan Americas Europe Asia Total unallocation total
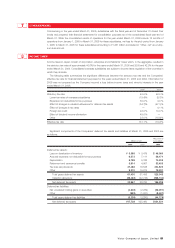
2004:
Sales
External sales ¥352,485 ¥218,877 ¥243,061 ¥107,555 ¥0,921,978 ¥ — ¥921,978
Intersegment
sales 271,194 965 1,638 193,209 467,006 (467,006) —
Total sales 623,679 219,842 244,699 300,764 1,388,984 (467,006) 921,978
Operating
expenses 608,592 222,343 237,922 294,810 1,363,667 466,840 896,827
Operating income
(loss) ¥015,087 ¥ (2,501) ¥006,777 ¥005,954 ¥0,025,317 ¥000(166) ¥025,151
Identifiable assets ¥318,387 ¥070,799 ¥089,361 ¥100,249 ¥0,578,796 ¥ (71,679) ¥507,117
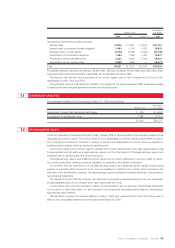
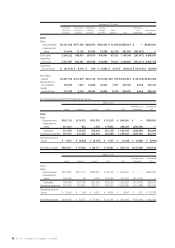
Thousands of U.S. dollars
Elimination and Consolidated
Japan Americas Europe Asia Total unallocation total
2006:
Sales
External sales $2,570,248 $1,832,239 $1,714,325 $0,779,769 $06,896,581 $ — $6,896,581
Intersegment
sales 1,797,777 5,411 12,205 1,503,359 3,318,752 (3,318,752) —
Total sales 4,368,025 1,837,650 1,726,530 2,283,128 10,215,333 (3,318,752) 6,896,581
Operating
expenses 4,333,460 1,891,958 1,756,231 2,268,111 10,249,760 (3,294,282) 6,955,478
Operating income
(loss) $0,034,565 $ (54,308) $ (29,701) $0,015,017 $ (34,427) $ (24,470) $ (58,897)
Identifiable assets $2,609,495 $0,576,949 $0,741,171 $0,808,436 $04,736,051 $ (917,145) $3,818,906
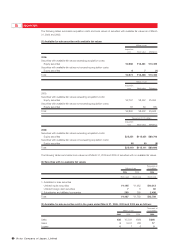
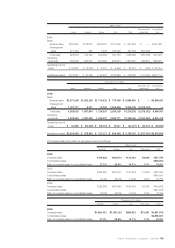
(3) Overseas sales information by geographic area is as follows:
Millions of yen
Americas Europe Asia Other areas Total
2006:
Overseas sales ¥218,603 ¥206,870 ¥113,482 ¥8,829 ¥547,784
Consolidated sales ¥806,900
Ratio of overseas sales to consolidated sales 27.1% 25.6% 14.1% 1.1% 67.9%
2005:
Overseas sales ¥204,650 ¥235,411 ¥119,578 ¥7,926 ¥567,565
Consolidated sales ¥840,591
Ratio of overseas sales to consolidated sales 24.4% 28.0% 14.2% 0.9% 67.5%
2004:
Overseas sales ¥225,849 ¥247,493 ¥140,424 ¥6,196 ¥619,962
Consolidated sales ¥921,978
Ratio of overseas sales to consolidated sales 24.5% 26.8% 15.2% 0.7% 67.2%
Thousands of U.S. dollars
Americas Europe Asia Other areas Total
2006:
Overseas sales $1,868,402 $1,768,120 $969,932 $75,461 $4,681,915
Consolidated sales $6,896,581
Ratio of overseas sales to consolidated sales 27.1% 25.6% 14.1% 1.1% 67.9%