JVC 2006 Annual Report Download - page 60
Download and view the complete annual report
Please find page 60 of the 2006 JVC annual report below. You can navigate through the pages in the report by either clicking on the pages listed below, or by using the keyword search tool below to find specific information within the annual report.-
 1
1 -
2
-
3
-
4
-
5
-
6
-
7
-
8
-
9
-
10
-
11
-
12
-
13
-
14
-
15
-
16
-
17
-
18
-
19
-
20
-
21
-
22
-
23
-
24
-
25
-
26
-
27
-
28
-
29
-
30
-
31
-
32
-
33
-
34
-
35
-
36
-
37
-
38
-
39
-
40
-
41
-
42
-
43
-
44
-
45
-
46
-
47
-
48
-
49
-
 50
50 -
 51
51 -
 52
52 -
 53
53 -
 54
54 -
 55
55 -
 56
56 -
 57
57 -
 58
58 -
 59
59 -
 60
60 -
 61
61 -
 62
62 -
 63
63 -
 64
64
 |
 |

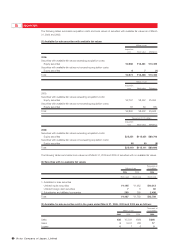
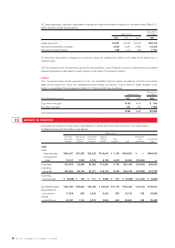
Thousands of U.S. dollars
Consumer Professional Components Software Eliminations
electronics electronics & Devices & Media Other and Consolidated
business business business business business Total unallocation total
2006:
Sales
External sales $5,131,598 $577,462 $258,530 $888,402 $040,589 $6,896,581 $ — $6,896,581
Intersegment
sales 114,624 11,153 35,385 57,589 42,736 261,487 (261,487) —
Total sales 5,246,222 588,615 293,915 945,991 83,325 7,158,068 (261,487) 6,896,581
Operating
expenses 5,327,897 582,461 292,966 924,068 79,300 7,206,692 (251,214) 6,955,478
Operating
income (loss) $(81,675) $006,154 $000,949 $021,923 $004,025 $ (48,624) $ (10,273) $ (58,897)
Identifiable
assets $2,397,308 $314,923 $224,769 $725,026 $211,786 $3,873,812 $ (54,906) $3,818,906
Depreciation &
amortization 153,060 7,350 24,829 30,632 7,291 223,162 6,308 229,470
Capital
expenditures 177,615 9,744 28,325 24,393 5,145 245,222 6,829 252,051
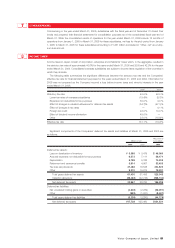
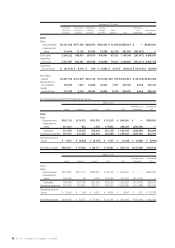
(2) Geographical segment information is as follows:
Millions of yen
Elimination and Consolidated
Japan Americas Europe Asia Total unallocation total
2006:
Sales
External sales ¥300,719 ¥214,372 ¥200,576 ¥091,233 ¥0,806,900 ¥ — ¥806,900
Intersegment
sales 210,340 633 1,428 175,893 388,294 (388,294) —
Total sales 511,059 215,005 202,004 267,126 1,195,194 (388,294) 806,900
Operating expenses 507,015 221,359 205,479 265,369 1,199,222 (385,431) 813,791
Operating income
(loss) ¥004,044 ¥ (6,354) ¥ (3,475) ¥001,757 ¥ (4,028) ¥00(2,863) ¥ (6,891)
Identifiable assets ¥305,311 ¥067,503 ¥086,717 ¥094,587 ¥0,554,118 ¥(107,306) ¥446,812
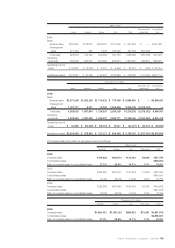
Millions of yen
Elimination and Consolidated
Japan Americas Europe Asia Total unallocation total
2005:
Sales
External sales ¥312,827 ¥201,113 ¥228,875 ¥097,776 ¥0,840,591 ¥ — ¥840,591
Intersegment
sales 206,559 82 1,518 203,456 411,615 (411,615) —
Total sales 519,386 201,195 230,393 301,232 1,252,206 (411,615) 840,591
Operating expenses 517,046 201,241 227,371 296,551 1,242,209 (411,988) 830,221
Operating income
(loss) ¥002,340 ¥ (46) ¥003,022 ¥004,681 ¥0,009,997 ¥000,373 ¥010,370
Identifiable assets ¥308,060 ¥074,275 ¥087,859 ¥091,740 ¥0,561,934 ¥ (95,385) ¥466,549
58 Victor Company of Japan, Limited