JVC 2006 Annual Report Download - page 58
Download and view the complete annual report
Please find page 58 of the 2006 JVC annual report below. You can navigate through the pages in the report by either clicking on the pages listed below, or by using the keyword search tool below to find specific information within the annual report.-
 1
1 -
2
-
3
-
4
-
5
-
6
-
7
-
8
-
9
-
10
-
11
-
12
-
13
-
14
-
15
-
16
-
17
-
18
-
19
-
20
-
21
-
22
-
23
-
24
-
25
-
26
-
27
-
28
-
29
-
30
-
31
-
32
-
33
-
34
-
35
-
36
-
37
-
38
-
39
-
40
-
41
-
42
-
43
-
44
-
45
-
46
-
47
-
 48
48 -
 49
49 -
 50
50 -
 51
51 -
 52
52 -
 53
53 -
 54
54 -
 55
55 -
 56
56 -
 57
57 -
 58
58 -
 59
59 -
 60
60 -
 61
61 -
 62
62 -
 63
63 -
 64
64
 |
 |

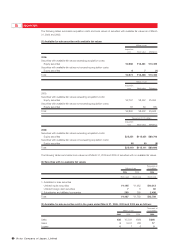
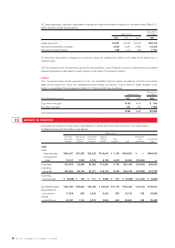
(3) Lease payments, assumed depreciation charges and assumed interest charges for the years ended March 31,
2006, 2005 and 2004 are as follows:
Thousands of
Millions of yen U.S. dollars
2006 2005 2004 2006
Lease payments ¥3,281 ¥3,790 ¥4,041 $28,043
Assumed depreciation charges 2,850 3,381 3,660 24,359
Assumed interest charges 206 277 334 1,761
(4) Assumed depreciation charges are computed using the straight-line method over lease terms assuming no
residual value.
(5) The excess amount of total lease payments over acquisition cost of leased property is deemed as accumulated
interest expenses and allocated for each period on the basis of the interest method.
Lessor:
The Companies lease certain equipment under non-capitalized finance leases, as lessees. And the Companies
lease those equipment under non-capitalized finance leases, as lessors. Future minimum lease receipts under
these non-capitalized finance leases at March 31, 2006 and 2005 are as follows:
Thousands of
Millions of yen U.S. dollars
Non-capitalized finance leases 2006 2005 2006
Due within one year ¥106 ¥341 $0,906
Due after one year 232 341 1,983
¥338 ¥682 $2,889
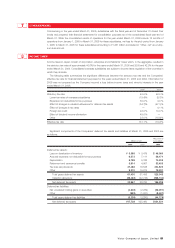
SEGMENT INFORMATION
Information by segment for the years ended March 31, 2006, 2005 and 2004 is shown in the tables below.
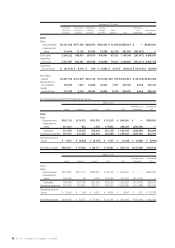
(1) Business segment information is as follows:
Millions of yen
Consumer Professional Components Software Eliminations
electronics electronics & Devices & Media Other and Consolidated
business business business business business Total unallocation total
2006:
Sales
External sales ¥600,397 ¥67,563 ¥30,248 ¥103,943 ¥04,749 ¥806,900 ¥ — ¥806,900
Intersegment
sales 13,411 1,305 4,140 6,738 5,000 30,594 (30,594) —
Total sales 613,808 68,868 34,388 110,681 9,749 837,494 (30,594) 806,900
Operating
expenses 623,364 68,148 34,277 108,116 9,278 843,183 (29,392) 813,791
Operating
income (loss) ¥ (9,556) ¥00,720 ¥00,111 ¥002,565 ¥00,471 ¥ (5,689) ¥ (1,202) ¥ (6,891)
Identifiable assets ¥280,485 ¥36,846 ¥26,298 ¥084,828 ¥24,779 ¥453,236 ¥ (6,424) ¥446,812
Depreciation &
amortization 17,908 860 2,905 3,584 853 26,110 738 26,848
Capital
expenditures 20,781 1,140 3,314 2,854 602 28,691 799 29,490
15
56 Victor Company of Japan, Limited