JVC 2006 Annual Report Download - page 48
Download and view the complete annual report
Please find page 48 of the 2006 JVC annual report below. You can navigate through the pages in the report by either clicking on the pages listed below, or by using the keyword search tool below to find specific information within the annual report.-
 1
1 -
2
-
3
-
4
-
5
-
6
-
7
-
8
-
9
-
10
-
11
-
12
-
13
-
14
-
15
-
16
-
17
-
18
-
19
-
20
-
21
-
22
-
23
-
24
-
25
-
26
-
27
-
28
-
29
-
30
-
31
-
32
-
33
-
34
-
35
-
36
-
37
-
 38
38 -
 39
39 -
 40
40 -
 41
41 -
 42
42 -
 43
43 -
 44
44 -
 45
45 -
 46
46 -
 47
47 -
 48
48 -
 49
49 -
 50
50 -
 51
51 -
 52
52 -
 53
53 -
 54
54 -
 55
55 -
 56
56 -
 57
57 -
 58
58 -
59
-
60
-
61
-
62
-
63
-
64
 |
 |

46 Victor Company of Japan, Limited
Thousands of
U.S. dollars
Millions of yen (Note 1)
2006 2005 2004 2006
Cash flows from operating activities:
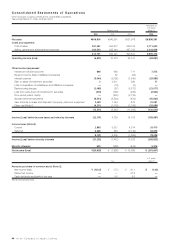
Income (Loss) before income taxes and minority interests ¥(22,101) ¥04,728 ¥14,106 $(188,897)
Depreciation 24,044 21,952 21,461 205,504
Interest and dividend income (886) (688) (711) (7,573)
Interest expense 3,040 3,092 2,840 25,983
Increase (Decrease) in accrued restructuring charges —(3,136) 2,263 —
Gain on sales of investment securities (2) (3,911) (280) (17)
Decrease in notes and accounts receivable 10,466 1,313 10,157 89,453
Decrease (Increase) in inventories 11,759 8,083 (23,463) 100,504
Increase (Decrease) in notes and accounts payable 5,041 (22,478) 13,917 43,085
Other (1,105) (7,285) 6,971 (9,444)
Sub-total 30,256 1,670 47,261 258,598
Interest and dividends received 886 700 721 7,573
Interest paid (3,017) (3,108) (2,913) (25,786)
Income taxes paid (4,535) (5,495) (4,342) (38,761)
Net cash provided by (used in) operating activities 23,590 (6,233) 40,727 201,624
Cash flows from investing activities:
Purchases of time deposits —(50) (9,100) —
Withdrawal of time deposits —4,155 13,100 —
Purchases of property, plant and equipment (27,525) (26,849) (21,124) (235,256)
Proceeds from sales of property, plant and equipment 6,517 5,199 5,132 55,701
Purchases of investment securities (52) (114) (1,465) (444)
Proceeds from sales of investment securities 36 5,541 886 308
Payments for investments in subsidiaries (278) —— (2,376)
Other (4,018) (1,744) (3,266) (34,343)
Net cash used in investing activities (25,320) (13,862) (15,837) (216,410)
Cash flows from financing activities:
Proceeds from long-term loans 30,000 ——256,410
Repayments of long-term loans (20,133) (5,987) (8,046) (172,077)
Redemption of bonds (36,120) (10,968) (6,519) (308,718)
Increase in short-term bank loans, net 25,995 3,673 5,367 222,179
Cash dividends paid (1,270) (1,629) (144) (10,855)
Other (1,283) (703) (34) (10,965)
Net cash used in financing activities (2,811) (15,614) (9,376) (24,026)
Effect of exchange rate changes on cash and cash equivalents 1,983 879 (2,571) 16,949
Net increase (decrease) in cash and cash equivalents (2,558) (34,830) 12,943 (21,863)
Cash and cash equivalents at beginning of the year 62,685 97,242 83,412 535,769
Effect of changes in the number of consolidated subsidiaries
and companies accounted for by the equity method — 273 887 —
Cash and cash equivalents at end of the year ¥60,127 ¥62,685 ¥97,242 $513,906
See accompanying notes.
Consolidated Statements of Cash Flows
Victor Company of Japan, Limited and its consolidated subsidiaries
Years ended March 31, 2006, 2005 and 2004