JVC 2006 Annual Report Download - page 4
Download and view the complete annual report
Please find page 4 of the 2006 JVC annual report below. You can navigate through the pages in the report by either clicking on the pages listed below, or by using the keyword search tool below to find specific information within the annual report.-
 1
1 -
 2
2 -
 3
3 -
 4
4 -
 5
5 -
 6
6 -
 7
7 -
 8
8 -
 9
9 -
 10
10 -
 11
11 -
 12
12 -
 13
13 -
 14
14 -
 15
15 -
16
-
17
-
18
-
19
-
20
-
21
-
22
-
23
-
24
-
25
-
26
-
27
-
28
-
29
-
30
-
31
-
32
-
33
-
34
-
35
-
36
-
37
-
38
-
39
-
40
-
41
-
42
-
43
-
44
-
45
-
46
-
47
-
48
-
49
-
50
-
51
-
52
-
53
-
54
-
55
-
56
-
57
-
58
-
59
-
60
-
61
-
62
-
63
-
64
 |
 |
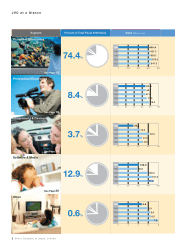
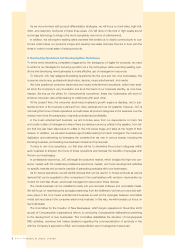
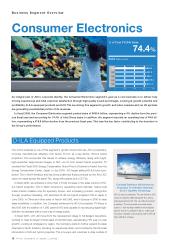
JVC at a Glance
2Victor Company of Japan, Limited
Consumer Electronics
Segment
74.4%
Percent of Total Fiscal 2006 Sales
2000 400 600 800
’06
’05
’04
’03
’02
600.4
627.3
638.1
675.0
641.3
Sales (Billions of Yen)
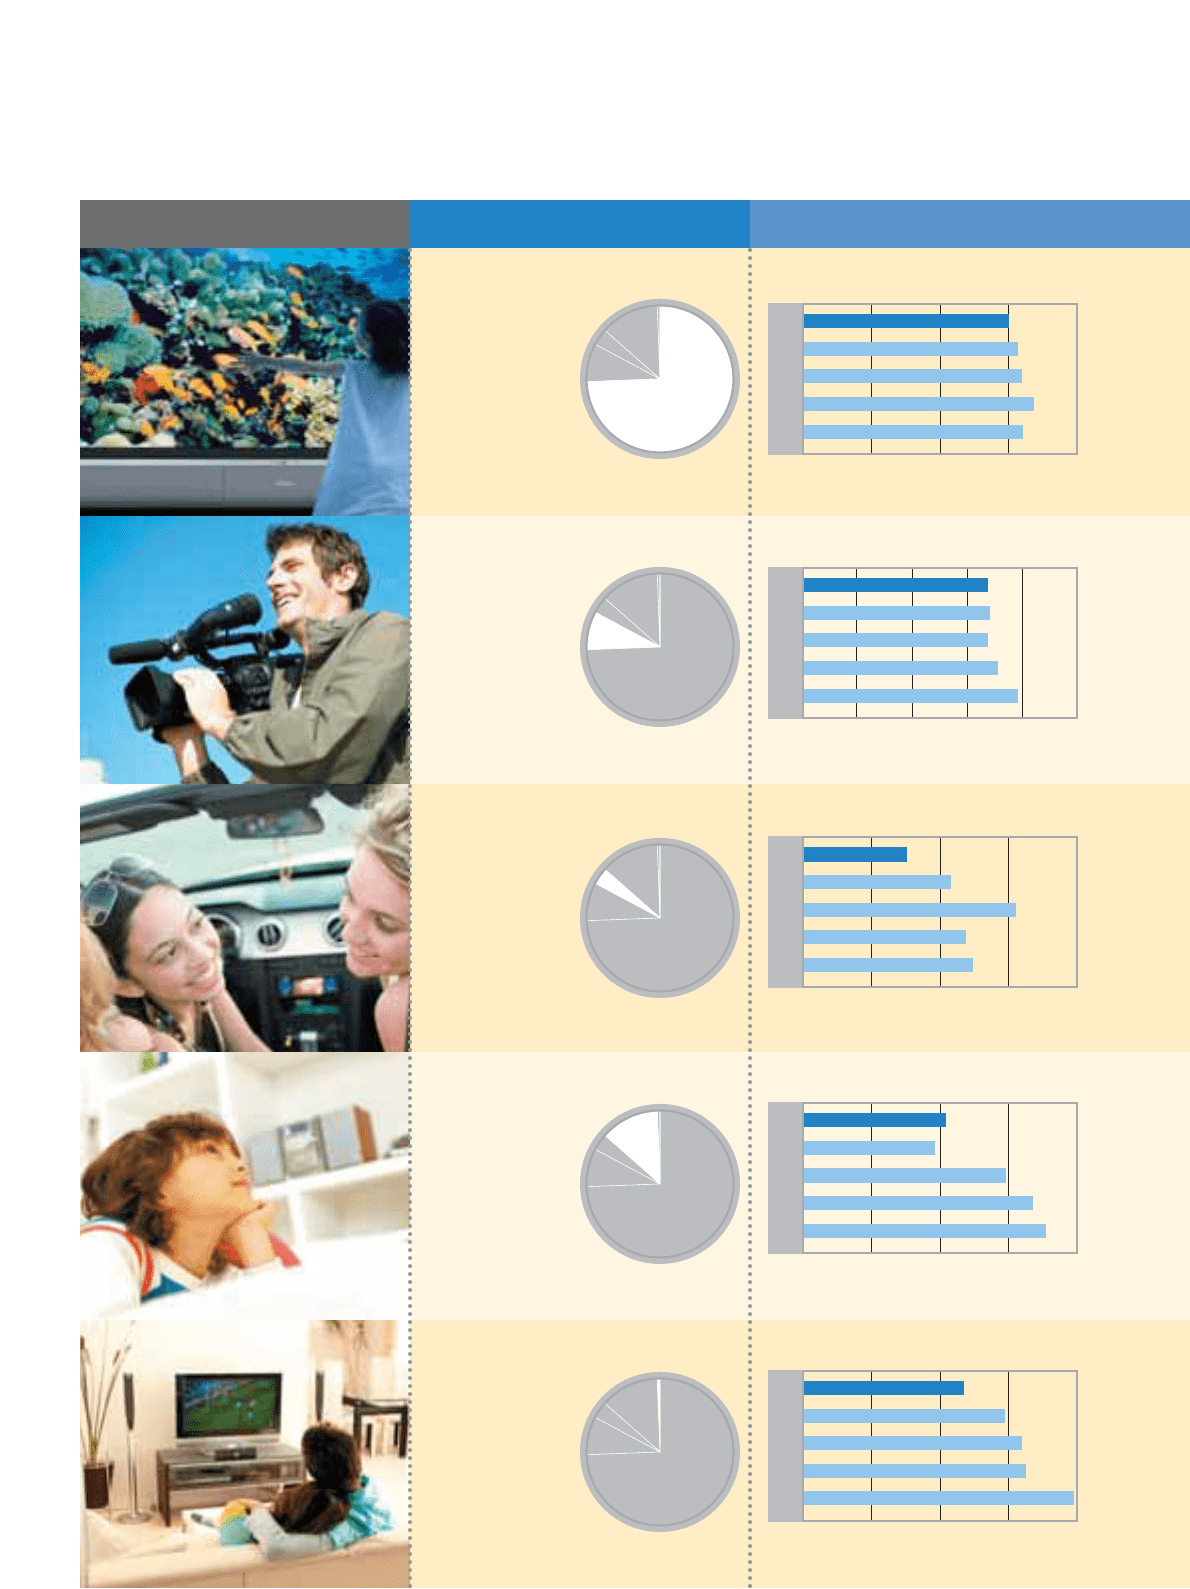
Professional Electronics
8.4%
200 40 60 80 100
’06
’05
’04
’03
’02
68.3
67.5
71.0
78.3
67.6
See Page 18
Components & Devices
3.7%
200 40 60 80
’06
’05
’04
’03
’02
43.2
62.0
47.6
49.7
30.2
See Page 19
Software & Media
12.9%
500 100 150 200
’06
’05
’04
’03
’02
95.9
148.0
167.5
177.0
103.9
See Page 20
Other
0.6%
20 4 68
’06
’05
’04
’03
’02
5.9
6.4
6.5
7.9
4.8
See Page 12
Other
Components & Devices