JVC 2006 Annual Report Download - page 42
Download and view the complete annual report
Please find page 42 of the 2006 JVC annual report below. You can navigate through the pages in the report by either clicking on the pages listed below, or by using the keyword search tool below to find specific information within the annual report.-
 1
1 -
2
-
3
-
4
-
5
-
6
-
7
-
8
-
9
-
10
-
11
-
12
-
13
-
14
-
15
-
16
-
17
-
18
-
19
-
20
-
21
-
22
-
23
-
24
-
25
-
26
-
27
-
28
-
29
-
30
-
31
-
 32
32 -
 33
33 -
 34
34 -
 35
35 -
 36
36 -
 37
37 -
 38
38 -
 39
39 -
 40
40 -
 41
41 -
 42
42 -
 43
43 -
 44
44 -
 45
45 -
 46
46 -
 47
47 -
 48
48 -
 49
49 -
 50
50 -
 51
51 -
 52
52 -
53
-
54
-
55
-
56
-
57
-
58
-
59
-
60
-
61
-
62
-
63
-
64
 |
 |

40 Victor Company of Japan, Limited
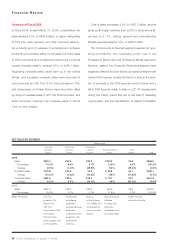
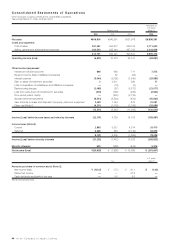
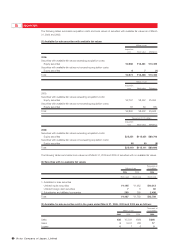
Total liabilities edged up 0.9%, or ¥2.9 billion, to ¥307.3
billion.
Although current liabilities declined ¥6.5 billion, to ¥248.6
billion, notes and accounts payable rose ¥9.9 billion.
Convertible bonds and bonds due within one year fell ¥19.5
billion due to the redemption of convertible bonds. Total
long-term liabilities increased ¥9.4 billion, to ¥58.7 billion, as
a ¥20.0 billion drop due to the shift of bonds to the “due
within one year” item was more than offset by a ¥29.9 bil-
lion rise due to new borrowings.
Stockholders’ equity decreased 13.9%, or ¥21.9 billion,
to ¥136.3 billion, and stockholders’ equity as a percentage
of total assets declined to 30.5%, compared with 33.9% at
the previous fiscal year-end.
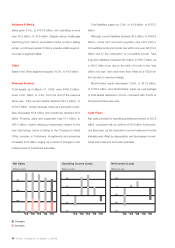
Cash Flows
Net cash provided by operating activities amounted to ¥23.6
billion, compared with an outflow of ¥6.2 billion in the previ-
ous fiscal year, as the loss before income taxes and minority
interests was offset by depreciation and decreases in inven-
tories and notes and accounts receivable.
Software & Media
Sales grew 8.4%, to ¥103.9 billion, and operating income
rose ¥0.2 billion, to ¥2.6 billion. Despite severe challenges
stemming from falls in recordable media product selling
prices, a continued series of hits by popular artists support-
ed a rise in segment sales.
Other
Sales in the Other segment dropped 19.2%, to ¥4.8 billion.
Financial Position
Total assets as of March 31, 2006, were ¥446.8 billion,
down ¥19.7 billion, or 4.2%, from the end of the previous
fiscal year. Total current assets declined ¥24.4 billion, to
¥318.5 billion, mainly because notes and accounts receiv-
able decreased ¥5.8 billion and inventories declined ¥5.6
billion. Property, plant and equipment rose ¥1.1 billion, to
¥97.4 billion, mainly reflecting investments related to the
new technology center building in the Company’s Head
Office complex in Yokohama. Investments and advances
increased ¥4.9 billion, largely as a result of changes in the
market prices of investment securities.
’02 ’03 ’04 ’05 ’06 ’02 ’03 ’04 ’05 ’06’02 ’03 ’04 ’05 ’06
250
0
500
750
-40
-60
-20
20
0
-10
-20
10
0
20
Net Sales
(Billions of yen)
Net Income (Loss)
(Billions of yen)
Operating Income (Loss)
(Billions of yen)
Overseas
Domestic