Garmin 2010 Annual Report Download - page 77
Download and view the complete annual report
Please find page 77 of the 2010 Garmin annual report below. You can navigate through the pages in the report by either clicking on the pages listed below, or by using the keyword search tool below to find specific information within the annual report.-
 1
1 -
2
-
3
-
4
-
5
-
6
-
7
-
8
-
9
-
10
-
11
-
12
-
13
-
14
-
15
-
16
-
17
-
18
-
19
-
20
-
21
-
22
-
23
-
24
-
25
-
26
-
27
-
28
-
29
-
30
-
31
-
32
-
33
-
34
-
35
-
36
-
37
-
38
-
39
-
40
-
41
-
42
-
43
-
44
-
45
-
46
-
47
-
48
-
49
-
50
-
51
-
52
-
53
-
54
-
55
-
56
-
57
-
58
-
59
-
60
-
61
-
62
-
63
-
64
-
65
-
66
-
 67
67 -
 68
68 -
 69
69 -
 70
70 -
 71
71 -
 72
72 -
 73
73 -
 74
74 -
 75
75 -
 76
76 -
 77
77 -
 78
78 -
 79
79 -
 80
80 -
 81
81 -
 82
82 -
 83
83 -
 84
84 -
 85
85 -
 86
86 -
 87
87 -
88
-
89
-
90
-
91
-
92
-
93
-
94
-
95
-
96
-
97
-
98
-
99
-
100
-
101
-
102
-
103
-
104
-
105
-
106
-
107
-
108
-
109
-
110
-
111
-
112
-
113
-
114
-
115
-
116
-
117
-
118
-
119
-
120
-
121
-
122
-
123
-
124
-
125
-
126
-
127
-
128
-
129
-
130
-
131
-
132
-
133
-
134
-
135
-
136
-
137
-
138
 |
 |

65
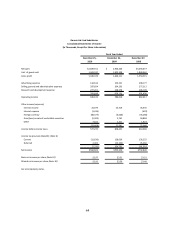
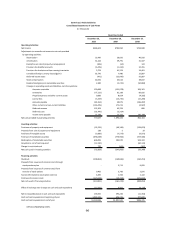
Garmin Ltd. And Subsidiaries
Consolidated Statements of Stockholders' Equity
(In Thousands, Except Share and Per Share Information)
Accumulated
Additional Other
Common Stock Paid-In Treasury Retained Comprehensive
Shares Dollars Capital Stock Earnings Gain/(Loss) Total
Balance at December 29, 2007 216,980 $1,086 $132,264 $0 $2,171,134 $46,130 $2,350,614
Net income – – – – 732,848 –732,848
Translation adjustment – – (3,053) –(1,595) (14,991) (19,639)
Adjustment related to unrealized
gains (losses) on available-for-sale
securities, net of income tax effects
of $150 – – – – – (68,790) (68,790)
Comprehensive income 644,419
Dividends paid – – – – (150,251) –(150,251)
Tax benefit from exercise of employee
stock options – – 2,143 – – – 2,143
Issuance of common stock from
exercise of stock options 158 2 2,873 – – – 2,875
Stock compensation – – 38,872 – – – 38,872
Purchase and retirement of
common stock (17,138) (86) (182,128) –(489,633) –(671,847)
Issuance of common stock through
stock purchase plan 363 –9,029 – – – 9,029
Balance at December 27, 2008 200,363 $1,002 $0 $0 $2,262,503 ($37,651) $2,225,854
Net income – – – – 703,950 –703,950
Translation adjustment – – – – – 24,537 24,537
Adjustment related to unrealized
gains (losses) on available-for-sale
securities, net of income tax effects
of $676 – – – – – (268) (268)
Comprehensive income 728,219
Dividends paid – – – – (149,846) –(149,846)
Tax benefit from exercise of employee
stock options – – 1,366 – – – 1,366
Issuance of common stock from
exercise of stock options 409 3 3,781 – – – 3,784
Stock compensation – – 43,616 – – – 43,616
Purchase and retirement of
common stock (708) (4) (20,254) – – – (20,258)
Issuance of common stock through
stock purchase plan 210 –3,712 – – – 3,712
Balance at December 26, 2009 200,274 $1,001 $32,221 $0 $2,816,607 ($13,382) $2,836,447
Net income – – – – 584,603 –584,603
Translation adjustment – – – – – 52,509 52,509
Adjustment related to unrealized gains
(losses) on available-for-sale securities
net of income tax effects of $348 – – – – – 16,877 16,877
Comprehensive income 653,989
Dividends paid – – – – (298,853) –(298,853)
Tax benefit from exercise of employee
stock options – – 4,495 – – – 4,495
Issuance of common stock from
exercise of stock options 928 2 (867) 10,330 – – 9,465
Stock compensation – – 40,332 – – – 40,332
Purchase and retirement of
common stock (prior to June 27, 2010) (6,844) (16) (67,528) –(41,296) –(108,840)
Purchase of treasury stock – – – (117,088) – – (117,088)
Impact of redomestication on par value
of common shares –1,796,448 – – (1,796,448) ––
Deferred tax impact of redomestication – – 29,615 – – – 29,615
Balance at December 25, 2010 194,358 $1,797,435 $38,268 ($106,758) $1,264,613 $56,004 $3,049,562
See accompanying notes.