Garmin 2010 Annual Report Download - page 61
Download and view the complete annual report
Please find page 61 of the 2010 Garmin annual report below. You can navigate through the pages in the report by either clicking on the pages listed below, or by using the keyword search tool below to find specific information within the annual report.-
 1
1 -
2
-
3
-
4
-
5
-
6
-
7
-
8
-
9
-
10
-
11
-
12
-
13
-
14
-
15
-
16
-
17
-
18
-
19
-
20
-
21
-
22
-
23
-
24
-
25
-
26
-
27
-
28
-
29
-
30
-
31
-
32
-
33
-
34
-
35
-
36
-
37
-
38
-
39
-
40
-
41
-
42
-
43
-
44
-
45
-
46
-
47
-
48
-
49
-
50
-
 51
51 -
 52
52 -
 53
53 -
 54
54 -
 55
55 -
 56
56 -
 57
57 -
 58
58 -
 59
59 -
 60
60 -
 61
61 -
 62
62 -
 63
63 -
 64
64 -
 65
65 -
 66
66 -
 67
67 -
 68
68 -
 69
69 -
 70
70 -
 71
71 -
72
-
73
-
74
-
75
-
76
-
77
-
78
-
79
-
80
-
81
-
82
-
83
-
84
-
85
-
86
-
87
-
88
-
89
-
90
-
91
-
92
-
93
-
94
-
95
-
96
-
97
-
98
-
99
-
100
-
101
-
102
-
103
-
104
-
105
-
106
-
107
-
108
-
109
-
110
-
111
-
112
-
113
-
114
-
115
-
116
-
117
-
118
-
119
-
120
-
121
-
122
-
123
-
124
-
125
-
126
-
127
-
128
-
129
-
130
-
131
-
132
-
133
-
134
-
135
-
136
-
137
-
138
 |
 |

51
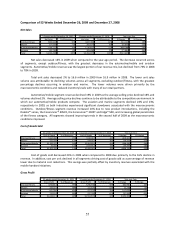
Comparison of 52-Weeks Ended December 25, 2010 and December 26, 2009
Net Sales
Net Sales % of Revenues Net Sales % of Revenues $ Change % Change
Outdoor/Fitness $559,592 21% $468,924 16% $90,668 19%
Marine 198,860 7% 177,644 6% 21,216 12%
Automotive/Mobile 1,668,939 62% 2,054,127 70% (385,188) -19%
Aviation 262,520 10% 245,745 8% 16,775 7%
Total $2,689,911 100% $2,946,440 100% ($256,529) -9%
52-weeks ended December 25, 2010
52-weeks ended December 26, 2009
Year over Year
Net sales decreased 9% in 2010 when compared to the year-ago period. The decrease occurred in
automotive/mobile and was partially offset by revenue growth in outdoor/fitness, marine and aviation. The
outdoor/fitness segment experienced the greatest increase at 19%. Automotive/mobile revenue remains the
largest portion of our revenue mix, but declined from 70% in 2009 to 62% in 2010.
Total unit sales decreased 4% to 16.0 million units in 2010 from 16.6 million units in 2009. The declining
unit sales volume in 2010 was attributable to a decline in automotive/mobile units due to increased saturation in
the segment and competing technologies partially offset by increasing volumes in the outdoor/fitness, marine and
aviation segments.
Automotive/mobile segment revenue declined 19% in 2010, as the average selling price and volumes
declined 11% and 9%, respectively. Outdoor/fitness segment revenue increased 19% on the strength of recent
product introductions that expand the addressable market and ongoing global penetration. Marine revenues
increased 12% due to product introductions, slight industry recovery and market share gains. Aviation revenues
increased 7% as the Company delivered into additional cockpits and the retrofit business began to recover.
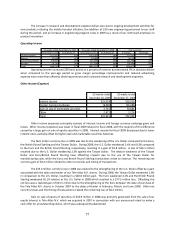
The Company anticipates ongoing revenue declines in 2011 driven by the automotive/mobile segment
with partially offsetting growth in the outdoor/fitness, aviation and marine segments. In general, management
believes that continuous innovation and the introduction of new products are essential for future revenue growth.
Cost of Goods Sold
Cost of Goods % of Revenues Cost of Goods % of Revenues $ Change % Change
Outdoor/Fitness $195,136 35% $162,082 35% $33,054 20%
Marine $74,212 37% $72,429 41% 1,783 2%
Automotive/Mobile $995,986 60% $1,192,227 58% (196,241) -16%
Aviation $78,203 30% $75,591 31% 2,612 3%
Total $1,343,537 50% $1,502,329 51% ($158,792) -11%
52-weeks ended December 25, 2010
52-weeks ended December 26, 2009
Year over Year
Cost of goods sold decreased 11% in 2010 when compared to the year-ago period which was generally
consistent with the change in revenue. The absolute dollar decrease occurred in automotive/mobile and was
partially offset by cost of goods increases in outdoor/fitness, marine and aviation. Cost of goods sold in 2010 was
positively impacted by 160 basis points due to a $42.8 million warranty adjustment related to refinement in the
estimated warranty reserve. This adjustment impacted all segments with automotive/mobile, outdoor/fitness and
marine having the largest benefits. Cost per unit declined in all segments driving stable to improving margins in
outdoor/fitness, marine and aviation.
Management believes that cost of goods sold as a percentage of sales will be stable in 2011 given current
component pricing.