Garmin 2010 Annual Report Download - page 65
Download and view the complete annual report
Please find page 65 of the 2010 Garmin annual report below. You can navigate through the pages in the report by either clicking on the pages listed below, or by using the keyword search tool below to find specific information within the annual report.-
 1
1 -
2
-
3
-
4
-
5
-
6
-
7
-
8
-
9
-
10
-
11
-
12
-
13
-
14
-
15
-
16
-
17
-
18
-
19
-
20
-
21
-
22
-
23
-
24
-
25
-
26
-
27
-
28
-
29
-
30
-
31
-
32
-
33
-
34
-
35
-
36
-
37
-
38
-
39
-
40
-
41
-
42
-
43
-
44
-
45
-
46
-
47
-
48
-
49
-
50
-
51
-
52
-
53
-
54
-
 55
55 -
 56
56 -
 57
57 -
 58
58 -
 59
59 -
 60
60 -
 61
61 -
 62
62 -
 63
63 -
 64
64 -
 65
65 -
 66
66 -
 67
67 -
 68
68 -
 69
69 -
 70
70 -
 71
71 -
 72
72 -
 73
73 -
 74
74 -
 75
75 -
76
-
77
-
78
-
79
-
80
-
81
-
82
-
83
-
84
-
85
-
86
-
87
-
88
-
89
-
90
-
91
-
92
-
93
-
94
-
95
-
96
-
97
-
98
-
99
-
100
-
101
-
102
-
103
-
104
-
105
-
106
-
107
-
108
-
109
-
110
-
111
-
112
-
113
-
114
-
115
-
116
-
117
-
118
-
119
-
120
-
121
-
122
-
123
-
124
-
125
-
126
-
127
-
128
-
129
-
130
-
131
-
132
-
133
-
134
-
135
-
136
-
137
-
138
 |
 |

55
Comparison of 52-Weeks Ended December 26, 2009 and December 27, 2008
Net Sales
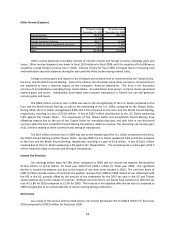
Net Sales % of Revenues Net Sales % of Revenues $ Change % Change
Outdoor/Fitness $468,924 16% $427,783 12% $41,141 10%
Marine 177,644 6% 204,477 6% (26,833) -13%
Automotive/Mobile 2,054,127 70% 2,538,411 73% (484,284) -19%
Aviation 245,745 8% 323,406 9% (77,661) -24%
Total $2,946,440 100% $3,494,077 100% ($547,637) -16%
52-weeks ended December 26, 2009
52-weeks ended December 27, 2008
Year over Year
Net sales decreased 16% in 2009 when compared to the year-ago period. The decrease occurred across
all segments, except outdoor/fitness, with the greatest decreases in the automotive/mobile and aviation
segments. Automotive/mobile revenue was the largest portion of our revenue mix, but declined from 73% in 2008
to 70% in 2009.
Total unit sales decreased 2% to 16.6 million in 2009 from 16.9 million in 2008. The lower unit sales
volume was attributable to declining volumes across all segments, excluding outdoor/fitness, with the greatest
percentage declines occurring in aviation and marine. The lower volumes were driven primarily by the
macroeconomic conditions and reduced inventory levels with many of our retail partners.
Automotive/mobile segment revenue declined 19% in 2009 as the average selling price declined 18% and
volumes declined 2%. Average selling price declines continue to be attributable to the competitive environment in
which our automotive/mobile products compete. The aviation and marine segments declined 24% and 13%,
respectively in 2009, as both industries experienced significant slowdowns associated with the macroeconomic
conditions. Outdoor/fitness segment revenue increased 10% due to new product introductions, including the
Dakota™ seies, the Foeue® CX, the Foeue® XT ad Edge® , and increasing global penetration
of the fitness category. All segments showed improving trends in the second half of 2009 as the macroeconomic
conditions improved.
Cost of Goods Sold
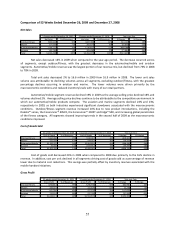
Cost of Goods % of Revenues Cost of Goods % of Revenues $ Change % Change
Outdoor/Fitness $162,082 35% $181,037 42% ($18,955) -10%
Marine $72,429 41% $93,052 46% (20,623) -22%
Automotive/Mobile $1,192,227 58% $1,560,816 61% (368,589) -24%
Aviation 75,591 31% $105,657 33% (30,066) -28%
Total $1,502,329 51% $1,940,562 56% ($438,233) -23%
52-weeks ended December 26, 2009
52-weeks ended December 27, 2008
Year over Year
Cost of goods sold decreased 23% in 2009 when compared to 2008 due primarily to the 16% decline in
revenue. In addition, cost per unit declined in all segments driving cost of goods sold as a percentage of revenue
lower due to material cost reductions. This savings was partially offset by inventory reserves associated with the
mobile handset initiatives.
Gross Profit
Gross Profit % of Revenues Gross Profit % of Revenues $ Change % Change
Outdoor/Fitness $306,842 65% $246,746 58% $60,096 24%
Marine 105,215 59% 111,425 54% (6,210) -6%
Automotive/Mobile 861,900 42% 977,595 39% (115,695) -12%
Aviation 170,154 69% 217,749 67% (47,595) -22%
Total $1,444,111 49% $1,553,515 44% ($109,404) -7%
52-weeks ended December 26, 2009
52-weeks ended December 27, 2008
Year over Year