Garmin 2010 Annual Report Download - page 58
Download and view the complete annual report
Please find page 58 of the 2010 Garmin annual report below. You can navigate through the pages in the report by either clicking on the pages listed below, or by using the keyword search tool below to find specific information within the annual report.-
 1
1 -
2
-
3
-
4
-
5
-
6
-
7
-
8
-
9
-
10
-
11
-
12
-
13
-
14
-
15
-
16
-
17
-
18
-
19
-
20
-
21
-
22
-
23
-
24
-
25
-
26
-
27
-
28
-
29
-
30
-
31
-
32
-
33
-
34
-
35
-
36
-
37
-
38
-
39
-
40
-
41
-
42
-
43
-
44
-
45
-
46
-
47
-
 48
48 -
 49
49 -
 50
50 -
 51
51 -
 52
52 -
 53
53 -
 54
54 -
 55
55 -
 56
56 -
 57
57 -
 58
58 -
 59
59 -
 60
60 -
 61
61 -
 62
62 -
 63
63 -
 64
64 -
 65
65 -
 66
66 -
 67
67 -
 68
68 -
69
-
70
-
71
-
72
-
73
-
74
-
75
-
76
-
77
-
78
-
79
-
80
-
81
-
82
-
83
-
84
-
85
-
86
-
87
-
88
-
89
-
90
-
91
-
92
-
93
-
94
-
95
-
96
-
97
-
98
-
99
-
100
-
101
-
102
-
103
-
104
-
105
-
106
-
107
-
108
-
109
-
110
-
111
-
112
-
113
-
114
-
115
-
116
-
117
-
118
-
119
-
120
-
121
-
122
-
123
-
124
-
125
-
126
-
127
-
128
-
129
-
130
-
131
-
132
-
133
-
134
-
135
-
136
-
137
-
138
 |
 |
48
Research and Development
The majority of our research and development costs represent salaries for our engineers, costs for high
technology components and costs of test equipment used in product and prototype development. Approximately
87% of the research and development of our products is performed in North America. The remainder of our
research and development activities is performed primarily by our Taiwan engineering group.
We are committed to increasing the level of innovative design and development of new products as we
strive for expanded ability to serve our existing consumer and aviation markets as well as new markets for GPS-
enabled devices. We expect our research and development budget in absolute terms to be stable in 2011.
Customers
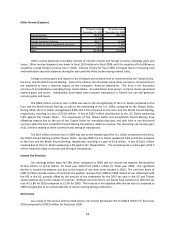
Our top ten customers have contributed between 34% and 36% of net sales since 2008. We have
experienced average sales days in our customer accounts receivable of between 70 and 78 days since 2008. We
have experienced an increase in the level of customer accounts receivable days due to changes in product mix,
longer payment terms, and macroeconomic conditions. We expect to reduce the level of customer accounts
receivable days as we negotiate shorter payment terms with our customers.
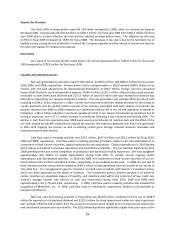
Income Taxes
We have experienced a relatively low effective corporate tax rate due to the proportion of our revenue
generated by entities in tax jurisdictions with low statutory rates. In particular, the profit entitlement afforded
our Swiss-based companies based on their intellectual property rights ownership of our consumer products along
with substantial tax incentives offered by the Taiwanese government on certain high-technology capital
investments have continued to reduce our tax rate. As a result, our consolidated effective tax rate was
approximately (1.3%) during 2010. The negative rate was due to the impact of one-time items booked in 2010.
The one-time items of ($98.7) million include the release of uncertain tax position reserves from 2006 to 2008
related to our settlement with the IRS in the US, partially offset by the amount of the settlement for the 2007 tax
year in the US and Taiwan surtax expense due to the release of reserves. Without one-time items, we would have
reported an effective tax rate of 15.8% for 2010 compared to 12.9% for 2009. This increase resulted from an
unfavorable mix of taxable income among the tax jurisdictions in which the Company operates. We have taken
advantage of the tax benefit in Taiwan since our inception and we expect to continue to benefit from lower
effective tax rates at least through 2015. Management believes that due to lower operating margins predicted for
fiscal 2011, there may be slightly less revenue recognized by entities in lower tax rate jurisdictions. Therefore, the
effective tax rate for fiscal 2011 is expected to be higher than fiscal 2010. The actual effective tax rate will be
dependent upon the operating margins, production volume, additional capital investments made during fiscal
2011, and the composition of our earnings.
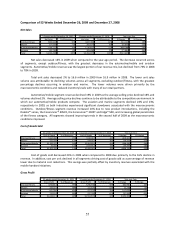
Results of Operations
The following table sets forth our results of operations as a percentage of net sales during the periods
shown: