Garmin 2010 Annual Report Download - page 68
Download and view the complete annual report
Please find page 68 of the 2010 Garmin annual report below. You can navigate through the pages in the report by either clicking on the pages listed below, or by using the keyword search tool below to find specific information within the annual report.-
 1
1 -
2
-
3
-
4
-
5
-
6
-
7
-
8
-
9
-
10
-
11
-
12
-
13
-
14
-
15
-
16
-
17
-
18
-
19
-
20
-
21
-
22
-
23
-
24
-
25
-
26
-
27
-
28
-
29
-
30
-
31
-
32
-
33
-
34
-
35
-
36
-
37
-
38
-
39
-
40
-
41
-
42
-
43
-
44
-
45
-
46
-
47
-
48
-
49
-
50
-
51
-
52
-
53
-
54
-
55
-
56
-
57
-
 58
58 -
 59
59 -
 60
60 -
 61
61 -
 62
62 -
 63
63 -
 64
64 -
 65
65 -
 66
66 -
 67
67 -
 68
68 -
 69
69 -
 70
70 -
 71
71 -
 72
72 -
 73
73 -
 74
74 -
 75
75 -
 76
76 -
 77
77 -
 78
78 -
79
-
80
-
81
-
82
-
83
-
84
-
85
-
86
-
87
-
88
-
89
-
90
-
91
-
92
-
93
-
94
-
95
-
96
-
97
-
98
-
99
-
100
-
101
-
102
-
103
-
104
-
105
-
106
-
107
-
108
-
109
-
110
-
111
-
112
-
113
-
114
-
115
-
116
-
117
-
118
-
119
-
120
-
121
-
122
-
123
-
124
-
125
-
126
-
127
-
128
-
129
-
130
-
131
-
132
-
133
-
134
-
135
-
136
-
137
-
138
 |
 |
58
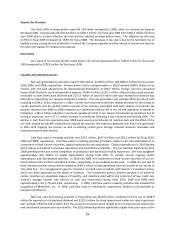
Income Tax Provision
Our fiscal 2009 earnings before taxes fell 12% when compared to 2008, while our income tax expense
decreased 42%. Income taxes fell $76.8 million, to $104.7 million, for fiscal year 2009 from $181.5 million for fiscal
year 2008, due to a lower effective tax rate and the reduced earnings before taxes. The effective tax rate was
12.9% for fiscal 2009 compared to 19.9% for fiscal 2008. The decrease in tax rate is due to the favorable mix of
taxable income among the tax jurisdictions in which the Company operates and the release of income tax reserves
for which the statute of limitations has expired.
Net Income
As a result of the various factors noted above, net income decreased 4% to $704.0 million for fiscal year
2009 compared to $732.8 million for fiscal year 2008.
Liquidity and Capital Resources
Net cash generated by operations was $770.6 million, $1,094.5 million, and $862.2 million for fiscal years
2010, 2009, and 2008, respectively. Primary drivers of the cash generation in 2010 included $584.6 million of net
income with non-cash adjustments for depreciation/amortization of $94.7 million, foreign currency unrealized
losses of $62.8 million, stock compensation expense of $40.3 million, $129.7 million related to decreased accounts
receivable as sales levels have declined and $131.3 million of sales for which cash was received but revenue was
deferred as required by our revenue recognition policies. This cash generation was partially offset by uses of cash
including a $144.5 million reduction in other current and noncurrent liabilities related primarily to the timing of
royalty payments and the $146.4 million reversal of tax reserves associated with both release of uncertain tax
position reserves from 2006 to 2008 related to our settlement with the IRS in the US and expiration of statute of
limitations, a $81.4 million reduction in accounts payable primarily in our Taiwan manufacturing operations due to
timing of payments, and a $77.1 million increase in inventories following a low inventory level exiting 2009. The
decline in cash flow from operations over 2009 levels was due to reduced net income levels and the effect of the
non cash income tax benefit realized from reduced tax reserves. We expect to generate cash flow from operations
in 2011 with ongoing net income, as well as working capital gains through reduced accounts receivable and
inventory levels as sales decline.
Cash flow used in investing activities was $72.9 million, $547.9 million and $56.3 million for fiscal 2010,
2009 and 2008, respectively. Cash flow used in investing activities principally relates to the net redemption of or
investment in fixed income securities, capital expenditures and acquisitions. Capital expenditures in 2010 totaled
$32.2 million and related to business operations and maintenance activities. This has declined significantly from
2008 spending levels due to the completion of production and warehouse facility expansions. We have budgeted
approximately $50 million of capital expenditures during fiscal 2011 to include normal ongoing capital
expenditures and maintenance activities. In 2010 and 2009, net investment in fixed income securities of our on-
hand cash was $25.5 million and $491.0 million, respectively, as we invested excess cash. In 2008, the net sale of
fixed income securities was primarily related to $239.3 million of cash generated from the tender of our shares of
Tele Atlas N.V. It is aageets goal to iest the o-had ash osistet ith Gais iestet poli,
hih has ee appoed the Boad of Dietos. The iestet polis pia pupose is to pesee
capital, maintain an acceptable degree of liquidity, and maximize yield within the constraint of low credit risk.
Gais aeage iteest ate etus o ash ad iestets duig fisal , ad ee
approximately 1.3%, 1.7% and 3.4%, respectively. In 2010, cash flow used in investing activities also included the
acquisition of MetriGear, Inc. In 2008, cash flow used in investing for acquisitions related to the purchase of
European distributors.
Net cash used by financing activities in fiscal 2010 was $510.8 million resulting from the use of $298.9
million for payment of our declared dividend and $225.9 million for stock repurchased under our stock repurchase
plan, partially offset by $14.0 million from the issuance of common stock related to our Company stock option plan
and stock based compensation tax benefits. The 2010 dividend paid was significantly higher than prior years as the