Fujitsu 2007 Annual Report Download - page 5
Download and view the complete annual report
Please find page 5 of the 2007 Fujitsu annual report below. You can navigate through the pages in the report by either clicking on the pages listed below, or by using the keyword search tool below to find specific information within the annual report.-
 1
1 -
 2
2 -
 3
3 -
 4
4 -
 5
5 -
 6
6 -
 7
7 -
 8
8 -
 9
9 -
 10
10 -
 11
11 -
 12
12 -
 13
13 -
 14
14 -
 15
15 -
 16
16 -
17
-
18
-
19
-
20
-
21
-
22
-
23
-
24
-
25
-
26
-
27
-
28
-
29
-
30
-
31
-
32
-
33
-
34
-
35
-
36
-
37
-
38
-
39
-
40
-
41
-
42
-
43
-
44
-
45
-
46
-
47
-
48
-
49
-
50
-
51
-
52
-
53
-
54
-
55
-
56
-
57
-
58
-
59
-
60
-
61
-
62
-
63
-
64
-
65
-
66
-
67
-
68
-
69
-
70
-
71
-
72
-
73
-
74
-
75
-
76
-
77
-
78
-
79
-
80
-
81
-
82
-
83
-
84
-
85
-
86
-
87
-
88
-
89
-
90
-
91
-
92
-
93
-
94
-
95
-
96
-
97
-
98
 |
 |

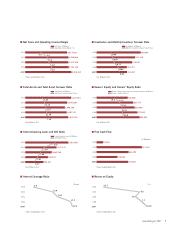
■ Net Sales and Operating Income Margin
Net Sales (¥ Millions)
Operating Income Margin (%)
2003
4,617,580
2.2 3.2
2004
4,766,888
3.4
2005
4,762,759
3.8
2006
4,791,416
3.6
2007
5,100,163
(Years ended March 31)
■ Total Assets and Total Asset Turnover Ratio
Total Assets (¥ Millions)
Total Asset Turnover Ratio (Times)
2003
4,225,361
1.05
2004
3,865,589
1.18
2005
3,640,198
1.27
2006
3,807,131
1.29
2007
3,943,724
1.32
(As of March 31)
■ Interest-bearing Loans and D/E Ratio
Interest-bearing Loans (¥ Millions)
D/E Ratio (Times)
2003 1,763,769
2.51
2004 1,277,121
1.54
2005 1,082,788
1.26
2006 928,613
1.01
2007 745,817
0.77
(As of March 31)
■ Interest Coverage Ratio
(Times)
3.9
2003
13.0
2004
15.2
2005
21.3
2006
22.2
2007
(Years ended March 31)
■ Inventories and Monthly Inventory Turnover Rate
Inventories (¥ Millions)
Monthly Inventory Turnover Rate (Times)
2003
595,984
0.59
2004
521,126
0.64
2005
478,510
0.71
2006
408,710
0.88
2007
412,387
0.93
(As of March 31)
■ Owners’ Equity and Owners’ Equity Ratio
Owners’ Equity (Net assets less minority interests) (¥ Millions)
Owners’ Equity Ratio (%)
2003
702,390
16.6 21.4
2004
827,177
23.5
2005
856,990
24.1
2006
917,045
24.6
2007
969,522
(As of March 31)
■ Free Cash Flow
(¥ Millions)
2003
53,382
2004
371,434
2005
262,103
2006
170,895
2007
257,682
(Years ended March 31)
■ Return on Equity
(%)
–15.7
2003
6.5
2004
2005 3.8
7.7
2006
10.9
2007
(Years ended March 31)
Annual Report 2007 3