Food Lion 2007 Annual Report Download - page 97
Download and view the complete annual report
Please find page 97 of the 2007 Food Lion annual report below. You can navigate through the pages in the report by either clicking on the pages listed below, or by using the keyword search tool below to find specific information within the annual report.-
 1
1 -
2
-
3
-
4
-
5
-
6
-
7
-
8
-
9
-
10
-
11
-
12
-
13
-
14
-
15
-
16
-
17
-
18
-
19
-
20
-
21
-
22
-
23
-
24
-
25
-
26
-
27
-
28
-
29
-
30
-
31
-
32
-
33
-
34
-
35
-
36
-
37
-
38
-
39
-
40
-
41
-
42
-
43
-
44
-
45
-
46
-
47
-
48
-
49
-
50
-
51
-
52
-
53
-
54
-
55
-
56
-
57
-
58
-
59
-
60
-
61
-
62
-
63
-
64
-
65
-
66
-
67
-
68
-
69
-
70
-
71
-
72
-
73
-
74
-
75
-
76
-
77
-
78
-
79
-
80
-
81
-
82
-
83
-
84
-
85
-
86
-
 87
87 -
 88
88 -
 89
89 -
 90
90 -
 91
91 -
 92
92 -
 93
93 -
 94
94 -
 95
95 -
 96
96 -
 97
97 -
 98
98 -
 99
99 -
 100
100 -
 101
101 -
 102
102 -
 103
103 -
 104
104 -
 105
105 -
 106
106 -
 107
107 -
108
-
109
-
110
-
111
-
112
-
113
-
114
-
115
-
116
-
117
-
118
-
119
-
120
 |
 |

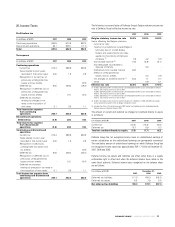
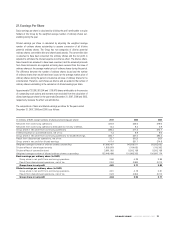
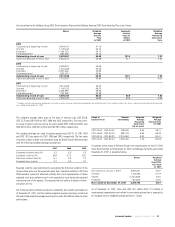
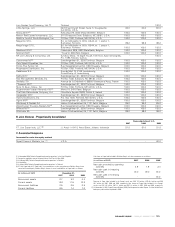
27. Earnings Per Share
Basic earnings per share is calculated by dividing the profit attributable to equity
holders of the Group by the weighted average number of ordinary shares out-
standing during the year.
Diluted earnings per share is calculated by adjusting the weighted average
number of ordinary shares outstanding to assume conversion of all dilutive
potential ordinary shares. The Group has two categories of dilutive potential
ordinary shares: convertible debt and share-based awards. The convertible debt
is assumed to have been converted into ordinary shares and the net profit is
adjusted to eliminate the interest expense less the tax effect. The dilutive share-
based awards are assumed to have been exercised, and the assumed proceeds
from these instruments are regarded as having been received from the issue of
ordinary shares at the average market price of ordinary shares during the period.
The difference between the number of ordinary shares issued and the number
of ordinary shares that would have been issued at the average market price of
ordinary shares during the period is treated as an issue of ordinary shares for no
consideration. Therefore, such shares are dilutive and are added to the number of
ordinary shares outstanding in the calculation of diluted earnings per share.
Approximately 737,998, 961,504 and 1,186,076 shares attributable to the exercise
of outstanding stock options and warrants were excluded from the calculation of
diluted earnings per share for the year ended December 31, 2007, 2006 and 2005,
respectively, because the effect was antidilutive.
The computation of basic and diluted earnings per share for the years ended
December 31, 2007, 2006 and 2005 is as follows:
(in millions of EUR, except numbers of shares and earnings per share) 2007 2006 2005
Net profit from continuing operations 400.8 425.6 379.6
Net profit from continuing operations attribuable to minority interests 14.4 8.4 4.9
Group share in net profit from continuing operations 386.4 417.2 374.7
Interest expense on convertible bond, net of tax 7.3 9.8 9.6
Group share in net profit from continuing operations for diluted earnings 393.7 427.0 384.3
Result from discontinued operations, net of tax 23.7 (65.3) (9.5)
Group share in net profit for diluted earnings 417.4 361.7 374.8
Weighted average number of ordinary shares outstanding 97,666,467 94,938,517 93,933,653
Dilutive effect of share-based awards 1,800,979 1,704,630 1,700,363
Dilutive effect of convertible bond 3,981,052 5,263,158 5,263,158
Weighted average number of diluted ordinary shares outstanding 103,448,498 101,906,305 100,897,174
Basic earnings per ordinary share (in EUR):
Group share in net profit from continuing operations 3.96 4.39 3.99
Result from discontinued operations, net of tax 0.24 (0.68) (0.10)
Group share in net profit 4.20 3.71 3.89
Diluted earnings per ordinary share (in EUR):
Group share in net profit from continuing operations 3.81 4.19 3.81
Result from discontinued operations, net of tax 0.23 (0.64) (0.10)
Group share in net profit 4.04 3.55 3.71
DELHAIZE GROUP / ANNUAL REPORT 2007 95