Food Lion 2007 Annual Report Download - page 96
Download and view the complete annual report
Please find page 96 of the 2007 Food Lion annual report below. You can navigate through the pages in the report by either clicking on the pages listed below, or by using the keyword search tool below to find specific information within the annual report.-
 1
1 -
2
-
3
-
4
-
5
-
6
-
7
-
8
-
9
-
10
-
11
-
12
-
13
-
14
-
15
-
16
-
17
-
18
-
19
-
20
-
21
-
22
-
23
-
24
-
25
-
26
-
27
-
28
-
29
-
30
-
31
-
32
-
33
-
34
-
35
-
36
-
37
-
38
-
39
-
40
-
41
-
42
-
43
-
44
-
45
-
46
-
47
-
48
-
49
-
50
-
51
-
52
-
53
-
54
-
55
-
56
-
57
-
58
-
59
-
60
-
61
-
62
-
63
-
64
-
65
-
66
-
67
-
68
-
69
-
70
-
71
-
72
-
73
-
74
-
75
-
76
-
77
-
78
-
79
-
80
-
81
-
82
-
83
-
84
-
85
-
 86
86 -
 87
87 -
 88
88 -
 89
89 -
 90
90 -
 91
91 -
 92
92 -
 93
93 -
 94
94 -
 95
95 -
 96
96 -
 97
97 -
 98
98 -
 99
99 -
 100
100 -
 101
101 -
 102
102 -
 103
103 -
 104
104 -
 105
105 -
 106
106 -
107
-
108
-
109
-
110
-
111
-
112
-
113
-
114
-
115
-
116
-
117
-
118
-
119
-
120
 |
 |

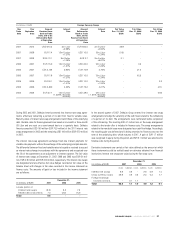
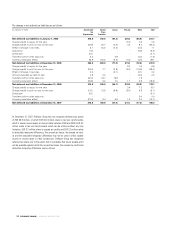
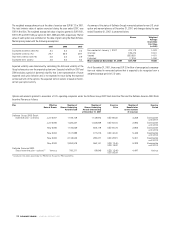
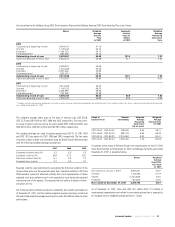
The changes in net deferred tax liabilities are as follows:
(in millions of EUR)
Accelerated Closed Leases Pension Other Total
Tax Store
Depreciation Provision
Net deferred tax liabilities at January 1, 2005 412.6 (73.0) (61.2) (22.3) (24.4) 231.7
Charge (credit) to equity for the year - - - (7.3) 7.6 0.3
Charge (credit) to profit or loss for the year (46.9) 20.7 (6.6) 4.0 8.4 (20.4)
Effect of change in tax rates 2.1 (0.3) (0.4) - (0.3) 1.1
Acquisition (1.3) - - - (0.9) (2.2)
Divestiture (0.1) - - - - (0.1)
Transfers to/from other accounts 2.0 - 0.8 - (4.3) (1.5)
Currency translation effect 53.8 (10.0) (9.6) (1.6) (4.5) 28.1
Net deferred tax liabilities at December 31, 2005 422.2 (62.6) (77.0) (27.2) (18.4) 237.0
Charge (credit) to equity for the year - - - 5.3 1.6 6.9
Charge (credit) to profit or loss for the year (34.4) 7.7 (3.9) (2.2) (16.6) (49.4)
Effect of change in tax rates 0.4 - (0.1) - (0.1) 0.2
Amount classified as held for sale 4.8 0.2 - - (3.0) 2.0
Transfers to/from other accounts (40.4) 18.7 19.9 - 1.8 -
Currency translation effect (35.8) 5.2 7.0 1.1 3.9 (18.6)
Net deferred tax liabilities at December 31, 2006 316.8 (30.8) (54.1) (23.0) (30.8) 178.1
Charge (credit) to equity for the year - - - 3.4 7.3 10.7
Charge (credit) to profit or loss for the year (13.1) 12.5 (8.8) (2.5) 2.8 (9.1)
Divestiture (0.1) - - - - (0.1)
Transfers to/from other accounts - - - - 0.4 0.4
Currency translation effect (27.0) 2.4 5.9 1.0 3.0 (14.7)
Net deferred tax liabilities at December 31, 2007 276.6 (15.9) (57.0) (21.1) (17.3) 165.3
At December 31, 2007, Delhaize Group has not recognized deferred tax assets
of EUR 38.9 million, of which EUR 30.0 million relate to tax loss carryforwards,
which if unused would expire at various dates between 2008 and 2026, EUR 3.2
million relate to tax loss carryforwards which can be utilized without any time
limitation, EUR 3.2 million relate to unused tax credits and EUR 2.5 million relate
to deductible temporary differences. The unused tax losses, the unused tax cred-
its and the deductible temporary differences may not be used to offset taxable
income or income taxes in other jurisdictions. Delhaize Group has recognized
deferred tax assets only to the extent that it is probable that future taxable profit
will be available against which the unused tax losses, the unused tax credits and
deductible temporary differences can be utilized.
DELHAIZE GROUP / ANNUAL REPORT 2007
94