Food Lion 2007 Annual Report Download - page 102
Download and view the complete annual report
Please find page 102 of the 2007 Food Lion annual report below. You can navigate through the pages in the report by either clicking on the pages listed below, or by using the keyword search tool below to find specific information within the annual report.-
 1
1 -
2
-
3
-
4
-
5
-
6
-
7
-
8
-
9
-
10
-
11
-
12
-
13
-
14
-
15
-
16
-
17
-
18
-
19
-
20
-
21
-
22
-
23
-
24
-
25
-
26
-
27
-
28
-
29
-
30
-
31
-
32
-
33
-
34
-
35
-
36
-
37
-
38
-
39
-
40
-
41
-
42
-
43
-
44
-
45
-
46
-
47
-
48
-
49
-
50
-
51
-
52
-
53
-
54
-
55
-
56
-
57
-
58
-
59
-
60
-
61
-
62
-
63
-
64
-
65
-
66
-
67
-
68
-
69
-
70
-
71
-
72
-
73
-
74
-
75
-
76
-
77
-
78
-
79
-
80
-
81
-
82
-
83
-
84
-
85
-
86
-
87
-
88
-
89
-
90
-
91
-
 92
92 -
 93
93 -
 94
94 -
 95
95 -
 96
96 -
 97
97 -
 98
98 -
 99
99 -
 100
100 -
 101
101 -
 102
102 -
 103
103 -
 104
104 -
 105
105 -
 106
106 -
 107
107 -
 108
108 -
 109
109 -
 110
110 -
 111
111 -
 112
112 -
113
-
114
-
115
-
116
-
117
-
118
-
119
-
120
 |
 |

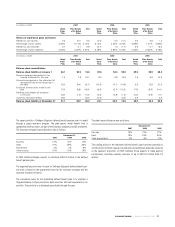
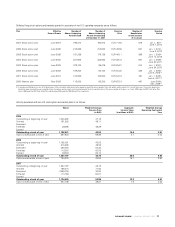
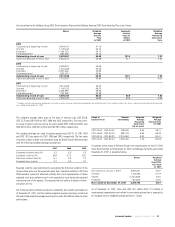
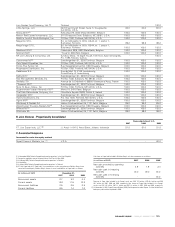
Restricted stock unit awards granted to associates of U.S. operating companies
under the Delhaize America 2002 Restricted Stock Unit Plan are as follows:
Effective Number of Number of Number of
Date of Grants Shares Underlying Shares Underlying Beneficiaries
Award Issued Awards Outstanding (at the moment
at December 31, 2007 of issuance)
June 2007 102,512 101,682 222
June 2006 155,305 148,507 217
May 2005 145,868 96,994 204
May 2004 179,567 73,665 193
May 2003 249,247 48,093 185
Activity related to the restricted stock plans is as follows:
Shares
2005
Outstanding at beginning of year 501,072
Granted 145,868
Released from restriction (137,570)
Forfeited/expired (13,478)
Outstanding at end of year 495,892
2006
Outstanding at beginning of year 495,892
Granted 155,305
Released from restriction (126,004)
Forfeited/expired (9,872)
Outstanding at end of year 515,321
2007
Outstanding at beginning of year 515,321
Granted 102,512
Released from restriction (137,625)
Forfeited/expired (11,267)
Outstanding at end of year 468,941
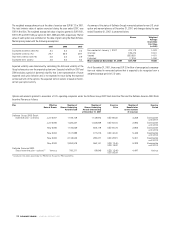
The weighted average fair value at date of grant for restricted stock unit awards
granted during 2007, 2006 and 2005 was USD 96.30, USD 63.04 and USD 60.76
based on the share price at the grant date, respectively.
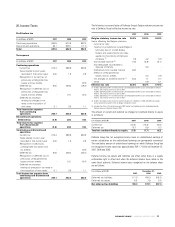
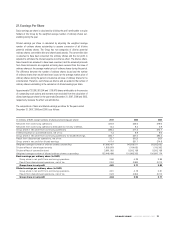
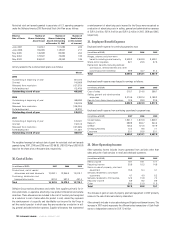
30. Cost of Sales
(in millions of EUR) 2007 2006 2005
Product cost, net of vendor
allowances and cash discounts 13,630.1 13,844.9 13,212.7
Purchasing, distribution and
transportation costs 531.8 527.3 497.4
Total 14,161.9 14,372.2 13,710.1
Delhaize Group receives allowances and credits from suppliers primarily for in-
store promotions, co-operative advertising, new product introduction and volume
incentives. These allowances are included in the cost of inventory and recognized
as a reduction to cost of sales when the product is sold, unless they represent
the reimbursement of a specific and identifiable cost incurred by the Group to
sell the vendor’s product in which case they are recorded as a reduction in sell-
ing, general and adminsitrative expenses. Supplier allowances that represented
a reimbursement of advertising costs incurred by the Group were recognized as
a reduction of advertising costs in selling, general and administrative expenses
of EUR 4.3 million, EUR 4.8 million and EUR 4.3 million in 2007, 2006 and 2005,
respectively.
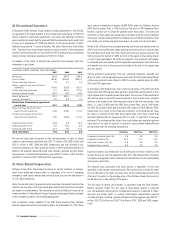
31. Employee Benefit Expense
Employee benefit expense for continuing operations was:
(in millions of EUR) 2007 2006 2005
Wages, salaries and short-term
benefits including social security 2,508.3 2,543.9 2,408.1
Share option expense 22.1 23.5 27.6
Retirement benefits (including defined
contribution, defined benefit and other
post-employment benefits) 59.9 44.7 51.3
Total 2,590.3 2,612.1 2,487.0
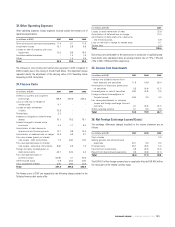
Employee benefit expense was charged to earnings as follows:
(in millions of EUR) 2007 2006 2005
Cost of sales 315.7 314.5 298.7
Selling, general and administrative
expenses 2,274.6 2,297.6 2,188.3
Results from discontinued operations 12.5 28.9 30.5
Total 2,602.8 2,641.0 2,517.5
Employee benefit expense from continuing operations by segment was:
(in millions of EUR) 2007 2006 2005
United States 1,831.7 1,876.8 1,808.7
Belgium 589.8 584.7 540.2
Greece 135.3 121.5 107.9
Emerging Markets 10.4 8.6 7.1
Corporate 23.1 20.5 23.1
Total 2,590.3 2,612.1 2,487.0
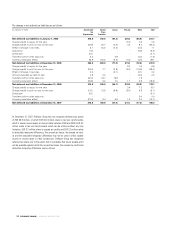
32. Other Operating Income
Other operating income includes income generated from activities other than
sales and point of sale services to retail and wholesale customers.
(in millions of EUR) 2007 2006 2005
Rental income 19.7 18.1 17.7
Recycling income 20.8 15.3 14.8
Gains on sale of property, plant and
equipment 15.6 5.4 4.1
Services rendered to wholesale
customers 4.7 4.0 5.3
Services rendered to third parties 12.2 10.8 7.4
Recovery income 8.9 8.2 9.9
Other 26.0 21.0 11.5
Total 107.9 82.8 70.7
The increase in gains on sale of property, plant and equipment in 2007 primarily
relates to the sale of idle real estate by Hannaford.
Other primarily includes in-store advertising and litigation settlement income. The
increase in 2007 mainly represents the different sales transactions of Cash Fresh
stores to independent owners for EUR 7.9 million.
DELHAIZE GROUP / ANNUAL REPORT 2007
100