Food Lion 2007 Annual Report Download - page 34
Download and view the complete annual report
Please find page 34 of the 2007 Food Lion annual report below. You can navigate through the pages in the report by either clicking on the pages listed below, or by using the keyword search tool below to find specific information within the annual report.-
 1
1 -
2
-
3
-
4
-
5
-
6
-
7
-
8
-
9
-
10
-
11
-
12
-
13
-
14
-
15
-
16
-
17
-
18
-
19
-
20
-
21
-
22
-
23
-
 24
24 -
 25
25 -
 26
26 -
 27
27 -
 28
28 -
 29
29 -
 30
30 -
 31
31 -
 32
32 -
 33
33 -
 34
34 -
 35
35 -
 36
36 -
 37
37 -
 38
38 -
 39
39 -
 40
40 -
 41
41 -
 42
42 -
 43
43 -
 44
44 -
45
-
46
-
47
-
48
-
49
-
50
-
51
-
52
-
53
-
54
-
55
-
56
-
57
-
58
-
59
-
60
-
61
-
62
-
63
-
64
-
65
-
66
-
67
-
68
-
69
-
70
-
71
-
72
-
73
-
74
-
75
-
76
-
77
-
78
-
79
-
80
-
81
-
82
-
83
-
84
-
85
-
86
-
87
-
88
-
89
-
90
-
91
-
92
-
93
-
94
-
95
-
96
-
97
-
98
-
99
-
100
-
101
-
102
-
103
-
104
-
105
-
106
-
107
-
108
-
109
-
110
-
111
-
112
-
113
-
114
-
115
-
116
-
117
-
118
-
119
-
120
 |
 |

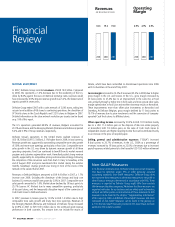
Financial
Review
18.3 19.2 19.0
2005 2006 2007
Revenues
(IN BILLIONS OF EUR)
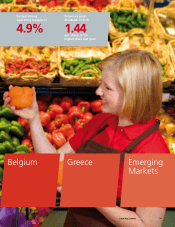
4.9% 4.9% 4.9%
2005 2006 2007
Operating
Margin
INCOME STATEMENT
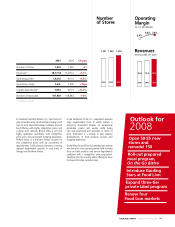
In 2007, Delhaize Group recorded revenues of EUR 19.0 billion. Compared
to 2006, this represents a 1.4% decrease due to the weakening of the U.S.
dollar by 8.4% against the euro. At identical exchange rates, revenues would
have increased by 4.9%. Organic revenue growth was 5.2%, the fastest rate of
organic growth in seven years.
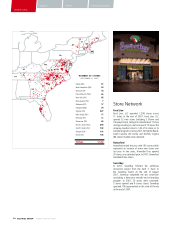
Delhaize Group ended 2007 with a sales network of 2,545 stores, taking into
account a net addition of 69 stores to continuing operations, the divestiture of
97 Delvita stores in the Czech Republic and 132 Di stores in Belgium in 2007.
Detailed information on the store network evolution per country can be found
on p. 106 of this report.
The U.S. operations generated 69.9% of revenues, Belgium accounted for
23.0% and Greece and the Emerging Markets (Romania and Indonesia) posted
6.2% and 0.9% of Group revenues, respectively.
Delhaize Group’s operations in the United States realized revenues of
USD 18.2 billion (EUR 13.3 billion), 5.1% higher than in 2006, in local currency.
Revenue growth was supported by outstanding comparable store sales growth
of 3.8% and more store openings, particularly at Food Lion. Comparable store
sales growth in the U.S. was driven by dynamic revenue growth at all three
operating companies. Food Lion continued to benefi t from its market renewal
program and customer segmentation work. Hannaford posted strong revenue
growth, supported by its competitive pricing and innovative strategy. Following
the completion of the conversion work from Kash ‘n Karry to Sweetbay at the
end of August 2007 and price investments that started during the summer
months, Sweetbay’s revenue growth was strong in most of the stores of the
network in the second half of 2007.
Revenues at Delhaize Belgium amounted to EUR 4.4 billion in 2007, a 1.7%
increase over 2006. Excluding the divestiture of the beauty and body care
business Di, revenues would have grown by 2.9% in 2007. Comparable store
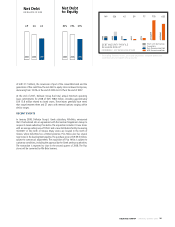
sales growth amounted to 1.6%. Market share declined by 36 basis points to
25.7% (source: AC Nielsen) due to many competitive openings, particularly
of discount stores, and the temporarily disruptive impact of the conversion of
Cash Fresh stores to Delhaize banners.
In 2007, revenues in Greece grew by 13.9% to EUR 1.2 billion due to high
comparable store sales growth and many new store openings. Revenues of
the Emerging Markets (Romania and Indonesia) of Delhaize Group increased
by 20.9% in 2007 to EUR 165.5 million due to the continued good revenue
performance in both countries. This amount does not include the results of
Delvita, which have been reclassifi ed to discontinued operations since 2006
until its divestiture at the end of May 2007.
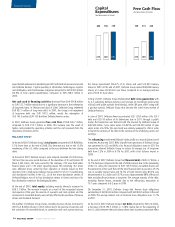
Gross margin increased to 25.3% of revenues (25.2% in 2006) due to higher
gross margin in the U.S. and Greece. In the U.S., gross margin increased by
20 basis points to 27.4% due to an improvement in the sales mix at Food
Lion, primarily through a higher mix in fresh sales and more private label sales,
margin optimization at Food Lion and excellent inventory results at Hannaford.
These improvements more than offset price investments at Hannaford and
Sweetbay. At Delhaize Belgium, gross margin declined by 11 basis points to
19.7% of revenues due to price investments and the conversion of company-
operated Cash Fresh stores to affi liated stores.
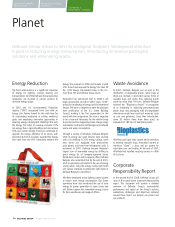
Other operating income increased by 30.2% to EUR 107.9 million mainly
due to a USD 11.3 million gain on the disposal of idle real estate property
at Hannaford, EUR 7.9 million gains on the sales of Cash Fresh stores to
independent owners and higher recycling income that can be attributed mainly
to an increase in the price of recycled paper.
Selling, general and administrative expenses (“SG&A”) increased
8 basis points to 20.7% of revenues. In the U.S., SG&A as a percentage of
revenues increased by 16 basis points to 22.0% of revenues due to increased
payroll expenses related primarily to the favorable USD 19.5 million retirement
Non-GAAP Measures
In its fi nancial communication, Delhaize Group uses certain measures
that have no defi nition under IFRS or other generally accepted
accounting standards (non-GAAP measures). Delhaize Group does
not represent these measures as alternative measures to net profi t or
other fi nancial measures determined in accordance with IFRS. These
measures as reported by Delhaize Group might differ from similarly
titled measures by other companies. We believe that these measures are
important indicators for our business and are widely used by investors,
analysts and other parties. A reconciliation of these measures to IFRS
measures can be found in the chapter “Supplementary Information”
of this report (p. 106). A defi nition of non-GAAP measures and ratios
composed of non-GAAP measures can be found in the glossary on
p. 116. The non-GAAP measures provided in this report have not been
audited by the statutory auditor.
DELHAIZE GROUP / ANNUAL REPORT 2007
32