Food Lion 2007 Annual Report Download - page 64
Download and view the complete annual report
Please find page 64 of the 2007 Food Lion annual report below. You can navigate through the pages in the report by either clicking on the pages listed below, or by using the keyword search tool below to find specific information within the annual report.-
 1
1 -
2
-
3
-
4
-
5
-
6
-
7
-
8
-
9
-
10
-
11
-
12
-
13
-
14
-
15
-
16
-
17
-
18
-
19
-
20
-
21
-
22
-
23
-
24
-
25
-
26
-
27
-
28
-
29
-
30
-
31
-
32
-
33
-
34
-
35
-
36
-
37
-
38
-
39
-
40
-
41
-
42
-
43
-
44
-
45
-
46
-
47
-
48
-
49
-
50
-
51
-
52
-
53
-
 54
54 -
 55
55 -
 56
56 -
 57
57 -
 58
58 -
 59
59 -
 60
60 -
 61
61 -
 62
62 -
 63
63 -
 64
64 -
 65
65 -
 66
66 -
 67
67 -
 68
68 -
 69
69 -
 70
70 -
 71
71 -
 72
72 -
 73
73 -
 74
74 -
75
-
76
-
77
-
78
-
79
-
80
-
81
-
82
-
83
-
84
-
85
-
86
-
87
-
88
-
89
-
90
-
91
-
92
-
93
-
94
-
95
-
96
-
97
-
98
-
99
-
100
-
101
-
102
-
103
-
104
-
105
-
106
-
107
-
108
-
109
-
110
-
111
-
112
-
113
-
114
-
115
-
116
-
117
-
118
-
119
-
120
 |
 |

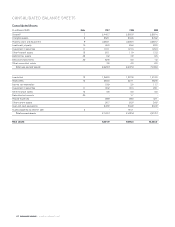
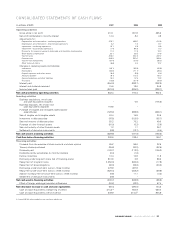
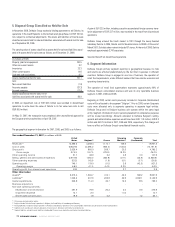
CONSOLIDATED BALANCE SHEETS
Consolidated Assets
(in millions of EUR) Note 2007 2006 2005
Goodwill 7 2,445.7 2,697.6 2,997.4
Intangible assets 8 552.1 604.6 675.2
Property, plant and equipment 9 3,383.1 3,400.0 3,587.7
Investment property 10 40.0 25.6 28.0
Investment in securities 11 116.1 121.0 125.0
Other financial assets 12 25.1 11.9 12.3
Deferred tax assets 26 6.2 7.9 5.5
Derivative instruments 20 52.8 0.2 1.2
Other non-current assets 3.8 4.0 8.3
Total
non-current
assets 6,624.9 6,872.8 7,440.6
Inventories 13 1,262.0 1,337.9 1,418.0
Receivables 14 564.6 527.1 482.6
Income tax receivables 18.9 2.5 11.7
Investment in securities 11 36.2 32.4 29.1
Other financial assets 12 6.8 0.3 0.3
Derivative instruments 20 - 1.7 -
Prepaid expenses 28.9 39.0 42.1
Other current assets 30.7 25.8 24.6
Cash and cash equivalents 248.9 304.8 804.9
Assets classified as held for sale 5 - 151.1 -
Total current assets
2,197.0 2,422.6 2,813.3
Total assets 8,821.9 9,295.4 10,253.9
DELHAIZE GROUP / ANNUAL REPORT 2007
62