Food Lion 2007 Annual Report Download - page 109
Download and view the complete annual report
Please find page 109 of the 2007 Food Lion annual report below. You can navigate through the pages in the report by either clicking on the pages listed below, or by using the keyword search tool below to find specific information within the annual report.-
 1
1 -
2
-
3
-
4
-
5
-
6
-
7
-
8
-
9
-
10
-
11
-
12
-
13
-
14
-
15
-
16
-
17
-
18
-
19
-
20
-
21
-
22
-
23
-
24
-
25
-
26
-
27
-
28
-
29
-
30
-
31
-
32
-
33
-
34
-
35
-
36
-
37
-
38
-
39
-
40
-
41
-
42
-
43
-
44
-
45
-
46
-
47
-
48
-
49
-
50
-
51
-
52
-
53
-
54
-
55
-
56
-
57
-
58
-
59
-
60
-
61
-
62
-
63
-
64
-
65
-
66
-
67
-
68
-
69
-
70
-
71
-
72
-
73
-
74
-
75
-
76
-
77
-
78
-
79
-
80
-
81
-
82
-
83
-
84
-
85
-
86
-
87
-
88
-
89
-
90
-
91
-
92
-
93
-
94
-
95
-
96
-
97
-
98
-
 99
99 -
 100
100 -
 101
101 -
 102
102 -
 103
103 -
 104
104 -
 105
105 -
 106
106 -
 107
107 -
 108
108 -
 109
109 -
 110
110 -
 111
111 -
 112
112 -
 113
113 -
 114
114 -
 115
115 -
 116
116 -
 117
117 -
 118
118 -
 119
119 -
120
 |
 |
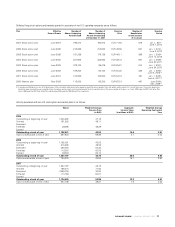
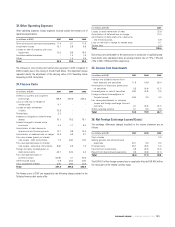
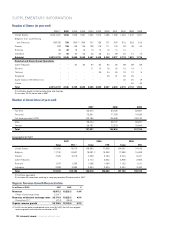
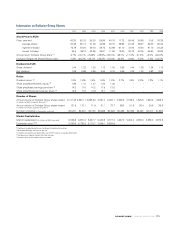
Results at Identical Exchange Rates
(in millions of EUR, except per share amounts) 2007 2006 2007/2006
At Actual Rates Effect of At Identical At Actual Rates At Actual Rates At Identical
Exchange Rates Rates Rates
Revenues 18,957.2 +1,214.7 20,171.9 19,225.2 -1.4% +4.9%
Operating profit 937.2 +68.3 1,005.5 946.3 -1.0% +6.3%
Net profit from continuing operations 400.8 +25.3 426.1 425.6 -5.8% +0.1%
Group share in net profit 410.1 +24.6 434.7 351.9 +16.5% +23.5%
Basic earnings per share 4.20 +0.25 4.45 3.71 +13.2% +19.9%
Diluted earnings per share 4.04 +0.23 4.27 3.55 +13.8% +20.3%
Free cash flow 326.7 +35.4 362.1 215.1 +51.9% +68.3%
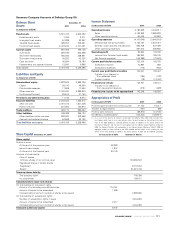
(in millions of EUR) December 31, 2007 December 31, 2006 Change
Net debt 2,244.0 +114.2 2,358.2 2,634.5 -14.8% -10.5%
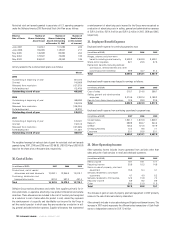
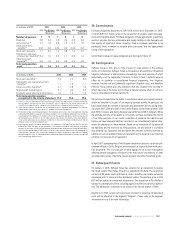
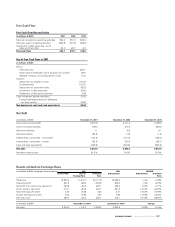
Net Debt
(in millions of EUR) December 31, 2007 December 31, 2006 December 31, 2005
Non-current financial debt 2,507.6 2,771.8 3,199.9
Current financial liabilities 189.4 317.9 694.2
Derivative liabilities 1.1 4.9 9.1
Derivative assets (52.8) (1.9) (1.2)
Investments in securities - non-current (116.2) (121.0) (125.0)
Investments in securities - current (36.2) (32.4) (29.1)
Cash and cash equivalents (248.9) (304.8) (804.9)
Net debt 2,244.0 2,634.5 2,943.0
Net debt to equity ratio 61.0% 74.0% 81.8%
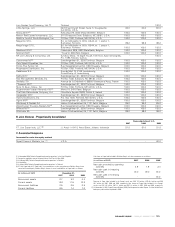
Free Cash Flow
Free Cash Flow Reconciliation
(in millions of EUR) 2007 2006 2005
Net cash provided by operating activities 932.3 910.3 902.3
Net cash used in investing activities (629.8) (721.9) (756.6)
Investment in debt securities, net of
sales and maturities 24.2 26.7 3.2
Free cash flow 326.7 215.1 148.9
Use of Free Cash Flow in 2007
(in millions of EUR)
Inflow:
Free cash flow 326.7
Stock options exercised, net of buyback own shares 29.6
Release of escrow for funding senior notes 10.4
Outflow:
Repayment to long-term loans (181.5)
Dividends paid (133.1)
Repayment of short-term loans (52.3)
Investment in debt securities (24.2)
Settlement of derivatives activities (6.8)
Cash movement before translation (31.2)
Foreign exchange translation difference
(on cash portion) (34.2)
Net decrease in cash and cash equivalents (65.4)
DELHAIZE GROUP / ANNUAL REPORT 2007 107