Experian 2009 Annual Report Download - page 99
Download and view the complete annual report
Please find page 99 of the 2009 Experian annual report below. You can navigate through the pages in the report by either clicking on the pages listed below, or by using the keyword search tool below to find specific information within the annual report.-
 1
1 -
2
-
3
-
4
-
5
-
6
-
7
-
8
-
9
-
10
-
11
-
12
-
13
-
14
-
15
-
16
-
17
-
18
-
19
-
20
-
21
-
22
-
23
-
24
-
25
-
26
-
27
-
28
-
29
-
30
-
31
-
32
-
33
-
34
-
35
-
36
-
37
-
38
-
39
-
40
-
41
-
42
-
43
-
44
-
45
-
46
-
47
-
48
-
49
-
50
-
51
-
52
-
53
-
54
-
55
-
56
-
57
-
58
-
59
-
60
-
61
-
62
-
63
-
64
-
65
-
66
-
67
-
68
-
69
-
70
-
71
-
72
-
73
-
74
-
75
-
76
-
77
-
78
-
79
-
80
-
81
-
82
-
83
-
84
-
85
-
86
-
87
-
88
-
 89
89 -
 90
90 -
 91
91 -
 92
92 -
 93
93 -
 94
94 -
 95
95 -
 96
96 -
 97
97 -
 98
98 -
 99
99 -
 100
100 -
 101
101 -
 102
102 -
 103
103 -
 104
104 -
 105
105 -
 106
106 -
 107
107 -
 108
108 -
 109
109 -
110
-
111
-
112
-
113
-
114
-
115
-
116
-
117
-
118
-
119
-
120
-
121
-
122
-
123
-
124
-
125
-
126
-
127
-
128
-
129
-
130
-
131
-
132
-
133
-
134
-
135
-
136
-
137
-
138
-
139
-
140
-
141
-
142
-
143
-
144
-
145
-
146
-
147
-
148
-
149
-
150
-
151
-
152
 |
 |

97Experian Annual Report 2009
Introduction
2 – 7
Business review
8 – 43
Governance
44 – 72
Financial statements
Group nancial statements
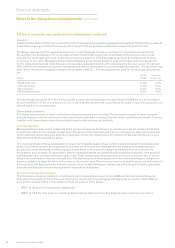
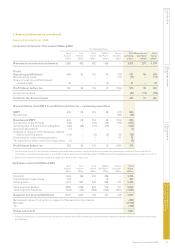
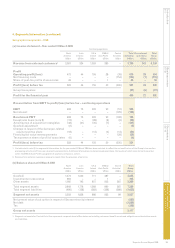
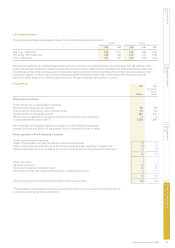
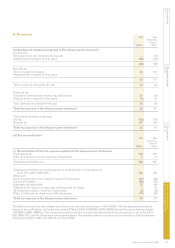
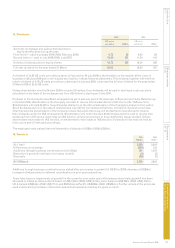
4. Segmental information (continued)
Year ended 31 March 2008
Continuing operations1
Credit Decision Marketing Central Total Discontinued Total
Services Analytics Services Interactive Activities continuing operations2 Group
US$m US$m US$m US$m US$m US$m US$m US$m
Revenue from external customers3 1,619 505 785 880 – 3,789 341 4,130
Prot
Operating prot/(loss) 430 143 8 156 (112) 625 29 654
Net nancing costs – – – – (154) (154) (1) (155)
Share of post-tax prots of associates 50 – – – – 50 – 50
Prot/(loss) before tax 480 143 8 156 (266) 521 28 549
Group tax expense (91) (6) (97)
Prot/(loss) for the nancial year 430 22 452
Reconciliation from EBIT to prot/(loss) before tax – continuing operations
EBIT 544 160 69 192 (57) 908
Net interest – – – – (125) (125)
Benchmark PBT 544 160 69 192 (182) 783
Exceptional items (note 8) (13) (10) (22) (4) (6) (55)
Amortisation of acquisition intangibles (45) (7) (37) (32) – (121)
Goodwill adjustment – – (2) – – (2)
Charges in respect of the demerger-related
equity incentive plans4 – – – – (49) (49)
Financing fair value remeasurements – – – – (29) (29)
Tax expense on share of prot of associates (6) – – – – (6)
Prot/(loss) before tax 480 143 8 156 (266) 521
1. As indicated in note 2 to the nancial statements, the segmental information for the year ended 31 March 2008 has been restated and the results of three of
the Group’s smaller businesses reclassied within the reporting of results for continuing operations. Whilst the reported results for Central Activities remain
unchanged, there are minor reclassications of revenue and prot measures within the other four segments. These reclassications relate to the Vente, Baker
Hill and Experian Payments businesses.
The effect of these reclassications has been to increase the revenue reported for Decision Analytics and Interactive by US$36m and US$21m respectively and
to reduce that for Credit Services and Marketing Services by US$12m and US$45m respectively. The associated effect has been to increase operating prot and
prot before tax for Decision Analytics and Interactive by US$6m and US$3m respectively and to reduce operating prot and prot before tax for Marketing
Services by US$9m.
2. As indicated in note 2 to the nancial statements, the segmental information for the year ended 31 March 2008 has been restated to reect the reclassication
of the Group’s transaction processing activities in France as a discontinued operation. Additional information on discontinued operations, the results of which
were formerly reported within the Credit Services business segment, is shown in note 11.
3. Revenue from external customers arose principally from the provision of services.
4. No allocation by business segment is made for charges in respect of the demerger-related equity incentive plans as the underlying data is maintained only to
provide an allocation by geographical segment.