Experian 2009 Annual Report Download - page 111
Download and view the complete annual report
Please find page 111 of the 2009 Experian annual report below. You can navigate through the pages in the report by either clicking on the pages listed below, or by using the keyword search tool below to find specific information within the annual report.-
 1
1 -
2
-
3
-
4
-
5
-
6
-
7
-
8
-
9
-
10
-
11
-
12
-
13
-
14
-
15
-
16
-
17
-
18
-
19
-
20
-
21
-
22
-
23
-
24
-
25
-
26
-
27
-
28
-
29
-
30
-
31
-
32
-
33
-
34
-
35
-
36
-
37
-
38
-
39
-
40
-
41
-
42
-
43
-
44
-
45
-
46
-
47
-
48
-
49
-
50
-
51
-
52
-
53
-
54
-
55
-
56
-
57
-
58
-
59
-
60
-
61
-
62
-
63
-
64
-
65
-
66
-
67
-
68
-
69
-
70
-
71
-
72
-
73
-
74
-
75
-
76
-
77
-
78
-
79
-
80
-
81
-
82
-
83
-
84
-
85
-
86
-
87
-
88
-
89
-
90
-
91
-
92
-
93
-
94
-
95
-
96
-
97
-
98
-
99
-
100
-
 101
101 -
 102
102 -
 103
103 -
 104
104 -
 105
105 -
 106
106 -
 107
107 -
 108
108 -
 109
109 -
 110
110 -
 111
111 -
 112
112 -
 113
113 -
 114
114 -
 115
115 -
 116
116 -
 117
117 -
 118
118 -
 119
119 -
 120
120 -
 121
121 -
122
-
123
-
124
-
125
-
126
-
127
-
128
-
129
-
130
-
131
-
132
-
133
-
134
-
135
-
136
-
137
-
138
-
139
-
140
-
141
-
142
-
143
-
144
-
145
-
146
-
147
-
148
-
149
-
150
-
151
-
152
 |
 |

109Experian Annual Report 2009
Introduction
2 – 7
Business review
8 – 43
Governance
44 – 72
Financial statements
Group nancial statements
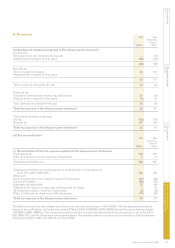
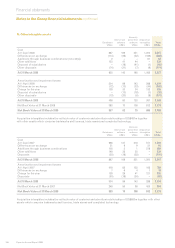
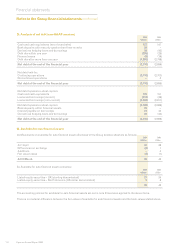
16. Property, plant and equipment
Short
Freehold leasehold Plant and
properties properties equipment To t a l
US$m US$m US$m US$m
Cost
At 1 April 2008 335 122 680 1,137
Differences on exchange (64) - (97) (161)
Additions through business combinations (note 33(a)) - - 1 1
Other additions 1 2 74 77
Disposal of subsidiaries (2) - (96) (98)
Other disposals (1) (1) (36) (38)
Transfers 3 - (3) –
At 31 March 2009 272 123 523 918
Depreciation
At 1 April 2008 68 26 439 533
Differences on exchange (9) - (64) (73)
Charge for the year 8 6 80 94
Disposal of subsidiaries - - (83) (83)
Other disposals - (1) (31) (32)
At 31 March 2009 67 31 341 439
Net Book Value at 31 March 2008 267 96 241 604
Net Book Value at 31 March 2009 205 92 182 479
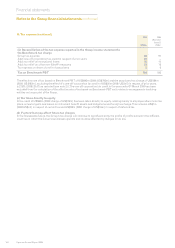
Short
Freehold leasehold Plant and
properties properties equipment To t a l
US$m US$m US$m US$m
Cost
At 1 April 2007 287 115 563 965
Differences on exchange 11 1 30 42
Additions through business combinations 33 - 36 69
Other additions 4 6 95 105
Disposals - - (44) (44)
At 31 March 2008 335 122 680 1,137
Depreciation
At 1 April 2007 55 19 372 446
Differences on exchange 5 1 20 26
Charge for the year 8 6 88 102
Disposals - - (41) (41)
At 31 March 2008 68 26 439 533
Net Book Value at 31 March 2007 232 96 191 519
Net Book Value at 31 March 2008 267 96 241 604
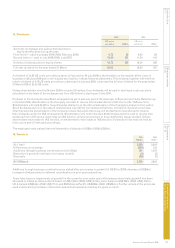
The Group leases plant and equipment under a number of nance lease agreements. At the end of each of the leases the
Group has the option to purchase the equipment at a benecial price. The net book value of assets held under nance leases
and capitalised in plant and equipment is US$9m (2008: US$18m).