Experian 2009 Annual Report Download - page 118
Download and view the complete annual report
Please find page 118 of the 2009 Experian annual report below. You can navigate through the pages in the report by either clicking on the pages listed below, or by using the keyword search tool below to find specific information within the annual report.-
 1
1 -
2
-
3
-
4
-
5
-
6
-
7
-
8
-
9
-
10
-
11
-
12
-
13
-
14
-
15
-
16
-
17
-
18
-
19
-
20
-
21
-
22
-
23
-
24
-
25
-
26
-
27
-
28
-
29
-
30
-
31
-
32
-
33
-
34
-
35
-
36
-
37
-
38
-
39
-
40
-
41
-
42
-
43
-
44
-
45
-
46
-
47
-
48
-
49
-
50
-
51
-
52
-
53
-
54
-
55
-
56
-
57
-
58
-
59
-
60
-
61
-
62
-
63
-
64
-
65
-
66
-
67
-
68
-
69
-
70
-
71
-
72
-
73
-
74
-
75
-
76
-
77
-
78
-
79
-
80
-
81
-
82
-
83
-
84
-
85
-
86
-
87
-
88
-
89
-
90
-
91
-
92
-
93
-
94
-
95
-
96
-
97
-
98
-
99
-
100
-
101
-
102
-
103
-
104
-
105
-
106
-
107
-
 108
108 -
 109
109 -
 110
110 -
 111
111 -
 112
112 -
 113
113 -
 114
114 -
 115
115 -
 116
116 -
 117
117 -
 118
118 -
 119
119 -
 120
120 -
 121
121 -
 122
122 -
 123
123 -
 124
124 -
 125
125 -
 126
126 -
 127
127 -
 128
128 -
129
-
130
-
131
-
132
-
133
-
134
-
135
-
136
-
137
-
138
-
139
-
140
-
141
-
142
-
143
-
144
-
145
-
146
-
147
-
148
-
149
-
150
-
151
-
152
 |
 |

116 Experian Annual Report 2009
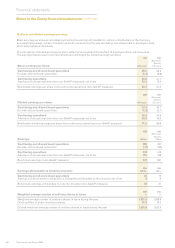
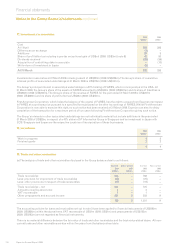
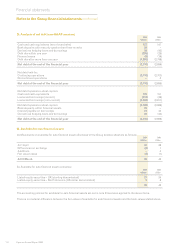
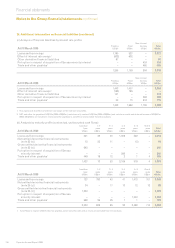
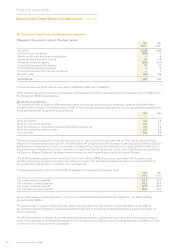
25. Other nancial assets and liabilities (continued)
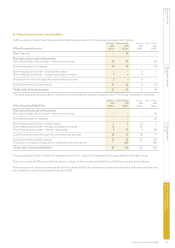
(b) The fair value and notional principal amounts at the balance sheet dates in respect of the Group’s derivative nancial
instruments are as follows:
2009 2008
Financial assets Financial liabilities Financial assets Financial liabilities
Fair value Notional Fair value Notional Fair value Notional Fair value Notional
US$m US$m US$m US$m US$m US$m US$m US$m
Interest rate swaps 46 770 83 1,570 26 977 88 3,443
Equity swaps – 29 2 11 – – 21 72
Foreign exchange contracts 7 262 12 380 4 296 32 1,223
53 1,061 97 1,961 30 1,273 141 4,738
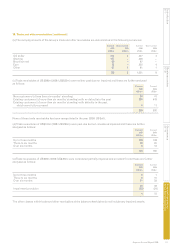
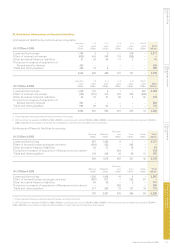
(c) Maturity of derivative nancial liabilities:
Less than 1 – 2 2 – 3 3 – 4 4 – 5 Over 5
1 year years years years years years To t a l
At 31 March 2009 US$m US$m US$m US$m US$m US$m US$m
Settled on a net basis:
Interest rate swaps 14 22 11 – (5) – 42
Equity swaps 1 1 – – – – 2
15 23 11 – (5) – 44
Settled on a gross basis – foreign exchange contracts 642 – – – – – 642
657 23 11 – (5) – 686
Less than 1 – 2 2 – 3 3 – 4 4 – 5 Over 5
1 year years years years years years To t a l
At 31 March 2008 US$m US$m US$m US$m US$m US$m US$m
Settled on a net basis:
Interest rate swaps 15 (5) 15 13 12 12 62
Equity swaps 19 5 2 – – – 26
34 – 17 13 12 12 88
Settled on a gross basis – foreign exchange contracts 1,223 – – – – – 1,223
1,257 – 17 13 12 12 1,311
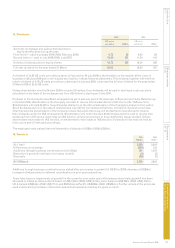
The table above analyses the Group’s derivative liabilities into relevant maturity groupings based on the remaining period
at the balance sheet date to the contractual maturity date. The amounts disclosed are the contractual undiscounted cash
outows/(inows) and accordingly differ from the carrying values and fair values.
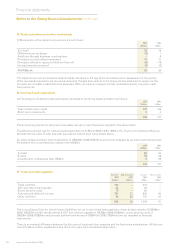
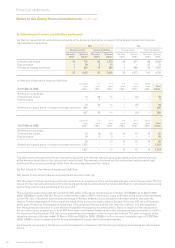
(d) Fair values of other nancial assets and liabilities
Fair values of derivative nancial instruments are set out in note (a).
The fair value of foreign exchange contracts is based on a comparison of the contractual and year end exchange rates. The fair
values of other derivative nancial instruments are estimated by discounting the future cash ows to net present values using
appropriate market rates prevailing at the year end.
The put option associated with the remaining 30% stake of Serasa is recognised as a liability of US$424m at 31 March 2009
(2008: US$583m) under IAS 39. The put is valued at the higher of 95% of the equity value of Serasa or the value of Serasa based
on the P/E ratio of Experian and the latest earnings of Serasa. A Monte Carlo simulation has been used to calculate the
liability. The key assumptions in arriving at the value of the put are the equity value of Serasa, the future P/E ratio of Experian
at the date of exercise, the respective volatilities of Experian and Serasa and the risk free rate in Brazil. It is also assumed
that the put may be exercised in June 2012 and thereafter recorded as a current liability. Gains in respect of the valuation of
the put option since acquisition in June 2007 have been recorded as nancing fair value remeasurements and relate to a fall in
the expected future Experian P/E ratio since acquisition and changes in the risk free rate in Brazil. The gain in respect of the
valuation arising in the year ended 31 March 2009 was US$21m (2008: US$69m) with a currency translation gain of US$138m
(2008: US$61m loss) recognised in the Group statement of recognised income and expense.
(e) Amounts recognised in the Group income statement in connection with the Group’s hedging instruments are disclosed in
note 9.
Notes to the Group nancial statements continued
Financial statements