Experian 2009 Annual Report Download - page 110
Download and view the complete annual report
Please find page 110 of the 2009 Experian annual report below. You can navigate through the pages in the report by either clicking on the pages listed below, or by using the keyword search tool below to find specific information within the annual report.-
 1
1 -
2
-
3
-
4
-
5
-
6
-
7
-
8
-
9
-
10
-
11
-
12
-
13
-
14
-
15
-
16
-
17
-
18
-
19
-
20
-
21
-
22
-
23
-
24
-
25
-
26
-
27
-
28
-
29
-
30
-
31
-
32
-
33
-
34
-
35
-
36
-
37
-
38
-
39
-
40
-
41
-
42
-
43
-
44
-
45
-
46
-
47
-
48
-
49
-
50
-
51
-
52
-
53
-
54
-
55
-
56
-
57
-
58
-
59
-
60
-
61
-
62
-
63
-
64
-
65
-
66
-
67
-
68
-
69
-
70
-
71
-
72
-
73
-
74
-
75
-
76
-
77
-
78
-
79
-
80
-
81
-
82
-
83
-
84
-
85
-
86
-
87
-
88
-
89
-
90
-
91
-
92
-
93
-
94
-
95
-
96
-
97
-
98
-
99
-
 100
100 -
 101
101 -
 102
102 -
 103
103 -
 104
104 -
 105
105 -
 106
106 -
 107
107 -
 108
108 -
 109
109 -
 110
110 -
 111
111 -
 112
112 -
 113
113 -
 114
114 -
 115
115 -
 116
116 -
 117
117 -
 118
118 -
 119
119 -
 120
120 -
121
-
122
-
123
-
124
-
125
-
126
-
127
-
128
-
129
-
130
-
131
-
132
-
133
-
134
-
135
-
136
-
137
-
138
-
139
-
140
-
141
-
142
-
143
-
144
-
145
-
146
-
147
-
148
-
149
-
150
-
151
-
152
 |
 |

108 Experian Annual Report 2009
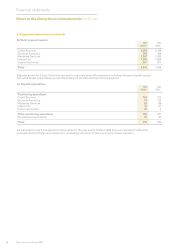
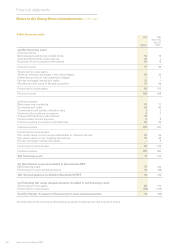
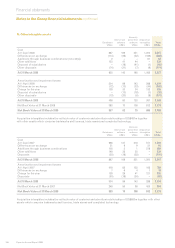
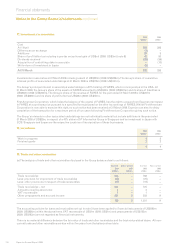
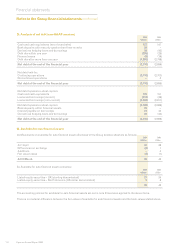
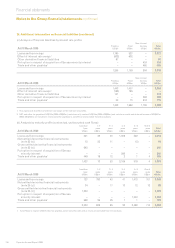
15. Other intangible assets
Internally
Internal use generated Acquisition
Databases software software intangibles To t a l
US$m US$m US$m US$m US$m
Cost
At 1 April 2008 887 169 251 1,200 2,507
Differences on exchange (113) (26) (52) (189) (380)
Additions through business combinations (note 33(a)) 2 – – 61 63
Other additions 153 41 44 – 238
Disposal of subsidiaries – (18) (41) (1) (60)
Other disposals (74) (21) (7) (9) (111)
At 31 March 2009 855 145 195 1,062 2,257
Amortisation and impairment losses
At 1 April 2008 504 99 143 288 1,034
Differences on exchange (72) (13) (33) (44) (162)
Charge for the year 139 30 34 132 335
Disposal of subsidiaries – (13) (18) (1) (32)
Other disposals (73) (20) (6) (8) (107)
At 31 March 2009 498 83 120 367 1,068
Net Book Value at 31 March 2008 383 70 108 912 1,473
Net Book Value at 31 March 2009 357 62 75 695 1,189
Acquisition intangibles includes the net book value of customer and advertiser relationships of US$487m together
with other assets which comprise trademarks and licences, trade names and completed technology.
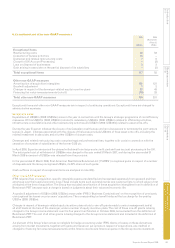
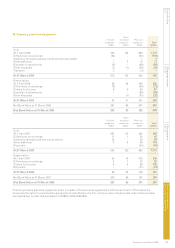
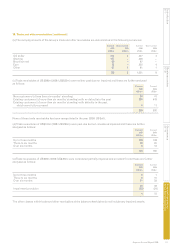
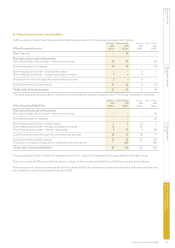
Internally
Internal use generated Acquisition
Databases software software intangibles To t a l
US$m US$m US$m US$m US$m
Cost
At 1 April 2007 666 137 218 571 1,592
Differences on exchange 21 9 9 51 90
Additions through business combinations 102 5 1 578 686
Other additions 148 36 55 – 239
Disposals (50) (18) (32) – (100)
At 31 March 2008 887 169 251 1,200 2,507
Amortisation and impairment losses
At 1 April 2007 418 82 122 166 788
Differences on exchange 7 6 4 1 18
Charge for the year 129 29 41 121 320
Disposals (50) (18) (24) – (92)
At 31 March 2008 504 99 143 288 1,034
Net Book Value at 31 March 2007 248 55 96 405 804
Net Book Value at 31 March 2008 383 70 108 912 1,473
Acquisition intangibles includes the net book value of customer and advertiser relationships of US$600m together with other
assets which comprise trademarks and licences, trade names and completed technology.
Notes to the Group nancial statements continued
Financial statements