Experian 2009 Annual Report Download - page 102
Download and view the complete annual report
Please find page 102 of the 2009 Experian annual report below. You can navigate through the pages in the report by either clicking on the pages listed below, or by using the keyword search tool below to find specific information within the annual report.-
 1
1 -
2
-
3
-
4
-
5
-
6
-
7
-
8
-
9
-
10
-
11
-
12
-
13
-
14
-
15
-
16
-
17
-
18
-
19
-
20
-
21
-
22
-
23
-
24
-
25
-
26
-
27
-
28
-
29
-
30
-
31
-
32
-
33
-
34
-
35
-
36
-
37
-
38
-
39
-
40
-
41
-
42
-
43
-
44
-
45
-
46
-
47
-
48
-
49
-
50
-
51
-
52
-
53
-
54
-
55
-
56
-
57
-
58
-
59
-
60
-
61
-
62
-
63
-
64
-
65
-
66
-
67
-
68
-
69
-
70
-
71
-
72
-
73
-
74
-
75
-
76
-
77
-
78
-
79
-
80
-
81
-
82
-
83
-
84
-
85
-
86
-
87
-
88
-
89
-
90
-
91
-
 92
92 -
 93
93 -
 94
94 -
 95
95 -
 96
96 -
 97
97 -
 98
98 -
 99
99 -
 100
100 -
 101
101 -
 102
102 -
 103
103 -
 104
104 -
 105
105 -
 106
106 -
 107
107 -
 108
108 -
 109
109 -
 110
110 -
 111
111 -
 112
112 -
113
-
114
-
115
-
116
-
117
-
118
-
119
-
120
-
121
-
122
-
123
-
124
-
125
-
126
-
127
-
128
-
129
-
130
-
131
-
132
-
133
-
134
-
135
-
136
-
137
-
138
-
139
-
140
-
141
-
142
-
143
-
144
-
145
-
146
-
147
-
148
-
149
-
150
-
151
-
152
 |
 |

100 Experian Annual Report 2009
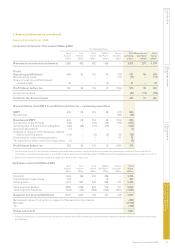
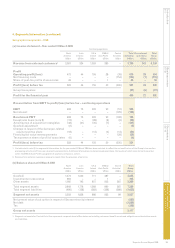
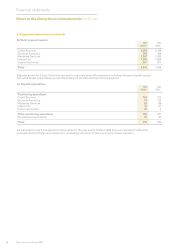
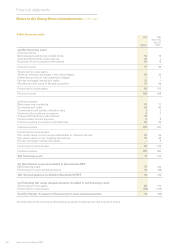
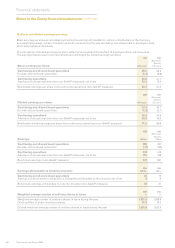
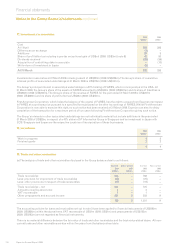
7. Employee benet costs and employee numbers
Aggregate employee costs for the continuing operations of the Group
2009 2008
(Restated)
(Note 2)
Notes US$m US$m
Wages and salaries 1,163 1,163
Social security costs 165 169
Share-based payments 27 55 76
Pension costs – dened benet plans 28 10 12
Pension costs – dened contribution plans 35 36
Total continuing operations 1,428 1,456
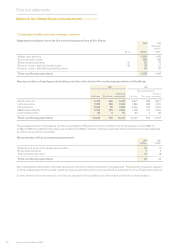
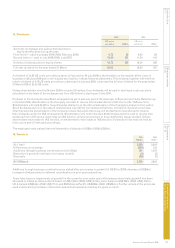
Average number of employees (including executive directors) in the continuing operations of the Group
2009 2008
(Restated) (Note 2)
Full time Full time
Full time Part time equivalent Full time Part time equivalent
North America 5,768 302 5,919 5,674 286 5,817
Latin America 2,355 228 2,469 1,846 258 1,975
UK & Ireland 3,549 99 3,599 4,004 205 4,106
EMEA/Asia Pacic 2,575 104 2,627 1,726 121 1,787
Central Activities 85 3 87 80 3 82
Total continuing operations 14,332 736 14,701 13,330 873 13,767
The average number of employees (full time equivalent) of Serasa in the nine months from its acquisition in June 2007 to
31 March 2008 was 2,505 and the employee numbers for 2008 in respect of Serasa reported within Latin America were adjusted
to reect the period of ownership.
Remuneration of key management personnel
2009 2008
US$m US$m
Salaries and short-term employee benets 12 12
Retirement benets 1 5
Share-based payments 13 18
Total continuing operations 26 35
Key management personnel comprises the board of directors and certain senior management. The amount included in respect
of share-based payments includes operating and exceptional costs for previous GUS awards and the one-off demerger awards.
Further details of the remuneration of directors are given in the audited part of the report on directors’ remuneration.
.
Notes to the Group nancial statements continued
Financial statements