Experian 2009 Annual Report Download - page 147
Download and view the complete annual report
Please find page 147 of the 2009 Experian annual report below. You can navigate through the pages in the report by either clicking on the pages listed below, or by using the keyword search tool below to find specific information within the annual report.-
 1
1 -
2
-
3
-
4
-
5
-
6
-
7
-
8
-
9
-
10
-
11
-
12
-
13
-
14
-
15
-
16
-
17
-
18
-
19
-
20
-
21
-
22
-
23
-
24
-
25
-
26
-
27
-
28
-
29
-
30
-
31
-
32
-
33
-
34
-
35
-
36
-
37
-
38
-
39
-
40
-
41
-
42
-
43
-
44
-
45
-
46
-
47
-
48
-
49
-
50
-
51
-
52
-
53
-
54
-
55
-
56
-
57
-
58
-
59
-
60
-
61
-
62
-
63
-
64
-
65
-
66
-
67
-
68
-
69
-
70
-
71
-
72
-
73
-
74
-
75
-
76
-
77
-
78
-
79
-
80
-
81
-
82
-
83
-
84
-
85
-
86
-
87
-
88
-
89
-
90
-
91
-
92
-
93
-
94
-
95
-
96
-
97
-
98
-
99
-
100
-
101
-
102
-
103
-
104
-
105
-
106
-
107
-
108
-
109
-
110
-
111
-
112
-
113
-
114
-
115
-
116
-
117
-
118
-
119
-
120
-
121
-
122
-
123
-
124
-
125
-
126
-
127
-
128
-
129
-
130
-
131
-
132
-
133
-
134
-
135
-
136
-
 137
137 -
 138
138 -
 139
139 -
 140
140 -
 141
141 -
 142
142 -
 143
143 -
 144
144 -
 145
145 -
 146
146 -
 147
147 -
 148
148 -
 149
149 -
 150
150 -
 151
151 -
 152
152
 |
 |
145Experian Annual Report 2009
Introduction
2 – 7
Business review
8 – 43
Governance
44 – 72
Financial statements
Company nancial statements
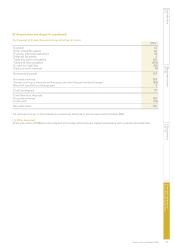
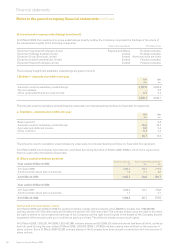
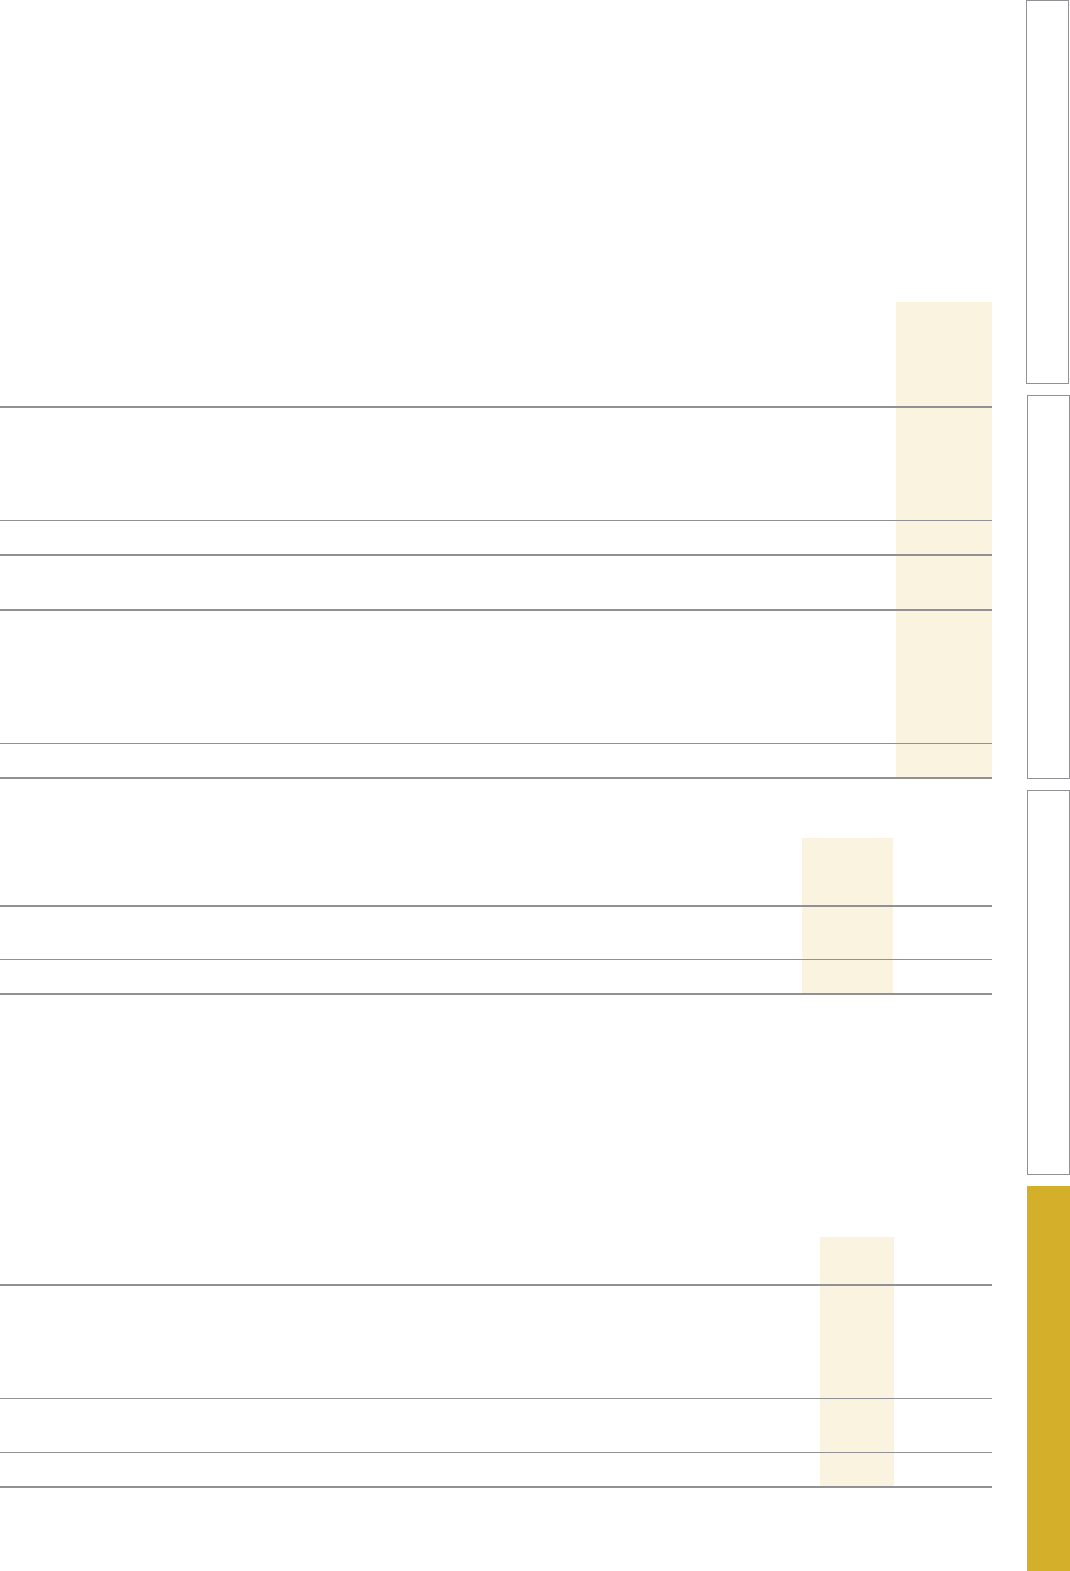
K. Share capital and share premium (continued)
Share premium
Share premium of £4.2m (2008: £3.7m) was created when ordinary shares were allotted under share option plans. The share
premium account is not available for distribution.
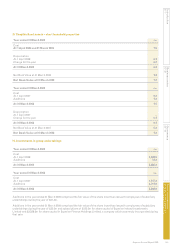
L. Reserves
Total prot
Prot and loss
Own and loss account
shares account reserve
Year ended 31 March 2009 £m £m £m
At 1 April 2008 (66.5) 5,128.9 5,062.4
Prot for the nancial year – 8.7 8.7
Equity dividends paid during the year – (34.1) (34.1)
Exercise of share options 11.6 (6.3) 5.3
Credit in respect of employee share incentive plans – 31.3 31.3
At 31 March 2009 (54.9) 5,128.5 5,073.6
Year ended 31 March 2008
At 1 April 2007 (86.0) 5,147.2 5,061.2
Loss for the nancial year – (15.2) (15.2)
Equity dividends paid during the year – (30.9) (30.9)
Purchase of own shares by employee trusts (3.2) – (3.2)
Exercise of share options 22.7 (5.2) 17.5
Credit in respect of employee share incentive plans – 33.0 33.0
At 31 March 2008 (66.5) 5,128.9 5,062.4
Own shares represent the cost of shares in the Company held by the following trusts to satisfy the Group’s obligations under
its employee share incentive plans:
2009 2008
Number Number
of shares of shares
The Experian plc Employee Share Trust 9,825,869 11,970,952
Experian UK Approved All Employee Share Plan 751,577 834,965
10,577,446 12,805,917
During the year ended 31 March 2008, a total of 509,518 ordinary shares were purchased by the trusts at a cost of £3.2m. During
the year ended 31 March 2009, 2,228,471 (2008: 4,289,949) ordinary shares were transferred from the trusts to
beneciaries of the Group’s employee share incentive plans.
As indicated in note F, during the year ended 31 March 2009 equity dividends of £34.1m (2008: £30.9m) were paid by the
Company to those Experian plc shareholders who did not elect to receive dividends under the Income Access Share (‘IAS’)
arrangements. In total, dividends of £107.6m (2008: £91.4m) were paid in the year of which £73.5m (2008: £60.5m) were paid by
Experian Finance plc under the IAS arrangements. Further details of the IAS arrangements are given in note 13 to the Group
nancial statements.
M. Reconciliation of movements in total equity shareholders’ funds
2009 2008
£m £m
Prot/(loss) for the nancial year 8.7 (15.2)
Equity dividends paid during the year (34.1) (30.9)
Purchase of own shares by employee trusts – (3.2)
Exercise of share options 9.6 21.2
Credit in respect of employee share incentive plans 31.3 33.0
Net increase in total equity shareholders’ funds 15.5 4.9
Opening total equity shareholders’ funds 5,894.6 5,889.7
Closing total equity shareholders’ funds 5,910.1 5,894.6